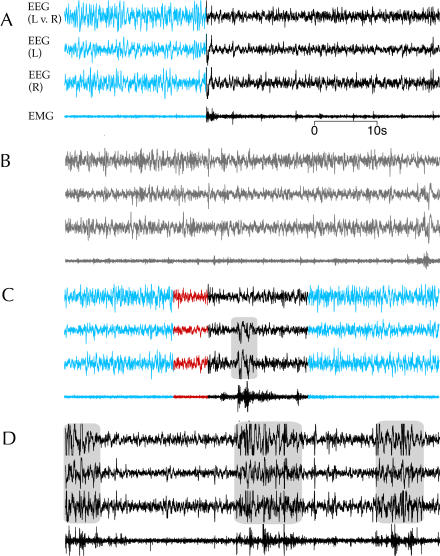
Figure 2. Examples of Electrophysiological Correlates of Behavioral States.
This figure shows four 1-min samples each containing three EEG recordings (left hemisphere vs. right hemisphere [L v. R], left hemisphere vs. neutral reference [L], and right hemisphere vs. neutral reference [R]) and one EMG from one sparrow (no. 65) depicting the typical electrophysiological correlates of each behavioral state.
(A) Transition from SWS (blue) to wakefulness (black).
(B) Drowsiness (gray).
(C) Transition from SWS (blue) to a bout of REM sleep (red), and then a brief awakening (black), followed by a return to SWS (blue).
(D) Wakefulness during a period of migratory restlessness.
High-amplitude artifacts associated with gross movements are shaded with a gray background. (A–C) were recorded on 11 August 2003, during the summer while the bird was in a nonmigratory state, and (D) was recorded on 11 October 2003, during the fall migratory period.

