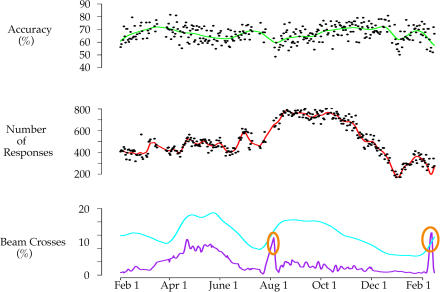
Figure 7. Comparison of Operant Responding and Migratory Behavior.
The average value for all birds of nighttime (purple) and daytime (blue) activity (percentage of 30-s epochs containing at least one infrared beam break) and the accuracy (green) and total number of responses (red) on the acquisition task (n = 8). As in Figure 1, the sharp high peaks (orange ovals) in early August of 2003 and early February of 2004 mark brief periods of experimenter-induced sleep restriction.

