
Figure 3. TR1exTH17 cell development in EAE and helminth infection.
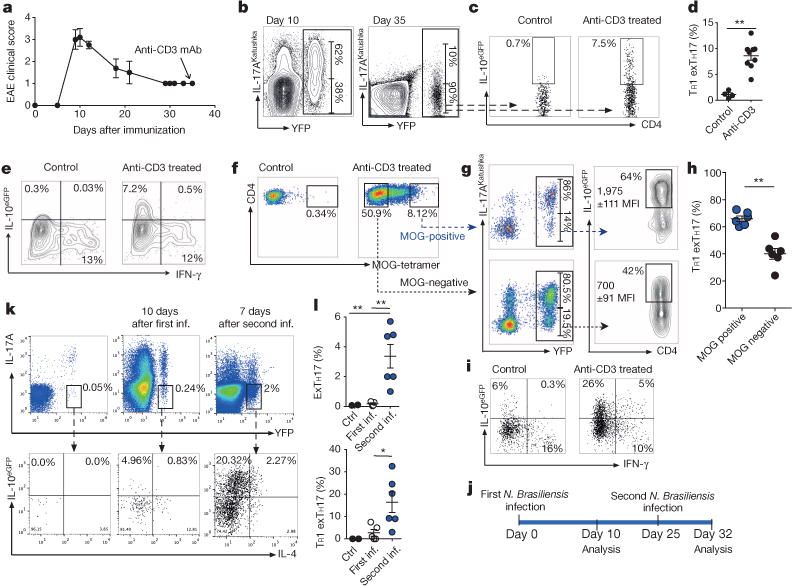
a, Clinical EAE-score.Anti-CD3 was injected 35 days after MOG-immunization. b, Flow cytometric analysis of TH17 and exTH17 (gated on YFP+ cells) cells in dLNs. c, d, Flow cytometric analysis (c)and percentages of TR1exTH17 cells (gated on exTH17)in dLNs (d). e, IFN-γ/IL-10eGFP expression of exTH17 cells. a–e, Representative of three independent experiments. f, Flow cytometric analysis of MOG-tetramer staining of intestinal CD4 cells of EAE mice left untreated (control) or treated with anti-CD3. g, h, Representative flow cytometric analysis (g) and frequencies of TR1exTH17 (gated on MOG ± cells) (h). Each dot represents one mouse. IL-10 MFIs (average of three mice ± s.e.m.) are reported. **P ≤ 0.05 by Mann–Whitney U-test, two tailed. i, IFN-γ/IL-10eGFP expression of exTH17 isolated from small intestine of EAE mice. f–i, Representative of two independent experiments. j, Schematic of the experiment. k, l, Flow cytometric analysis and frequencies of exTH17 and TR1exTH17 from the lung (upper panel: gatedonCD4+ T cells; lower panel: gated on exTH17 cells). One experiment of three is shown. Mean ± s.e.m., *P ≤ 0.05, **P ≤ 0.005 by ANOVA (Tukey’s multiple comparison test).