
Extended Data Figure 8. Gene expression of TR1, TR1exTH17 and TH17 cells.
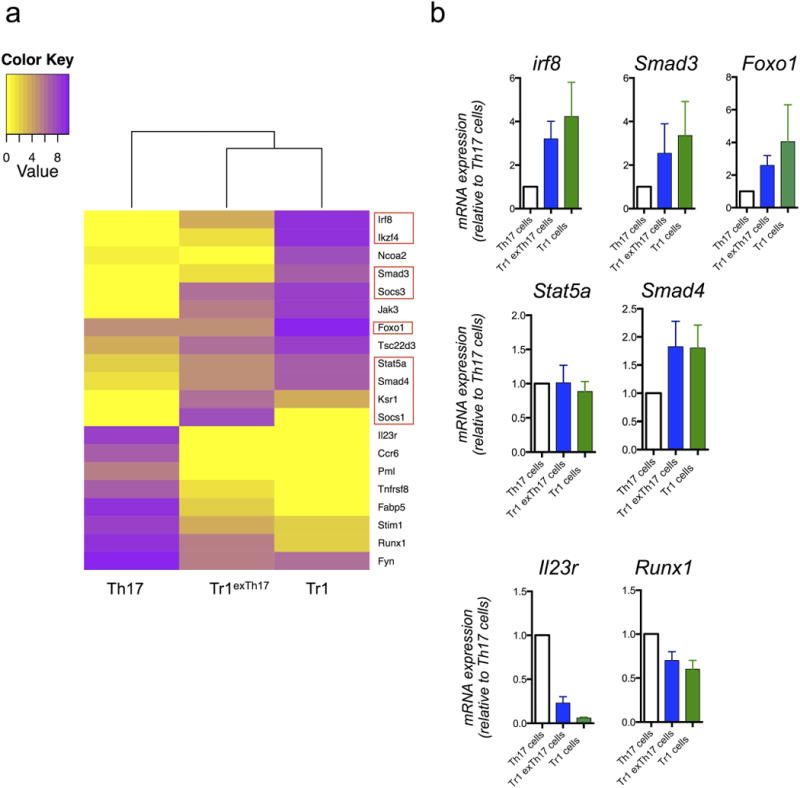
a, Heat map of genes selectively expressed in both TR1exTH17 and TR1 compared to TH17 cells. The bioinformatics analysis is based on the genes listed in Supplementary Table 1. Red squares highlight genes linked to TGF-β1 signalling. b, Relative mRNA expression of the indicated genes in TR1, TR1exTH17 and TH17 cells FACS sorted form the intestine of Fate+ mice treated with anti-CD3 monoclonal antibody is shown. Values shown are relative to TH17 cell gene expression. Mean and s.e.m. of biological independent experiments (IRF8 n = 2; SMAD3 n = 4; FOXO1 n = 2; STAT5a n = 3; SMAD4 n = 4) except for IL-23 and Runx1 (n = 2 technical replicates) are shown. In each experiment we pooled intestinal lymphocytes isolated from 7 treated mice before FACS sorting.