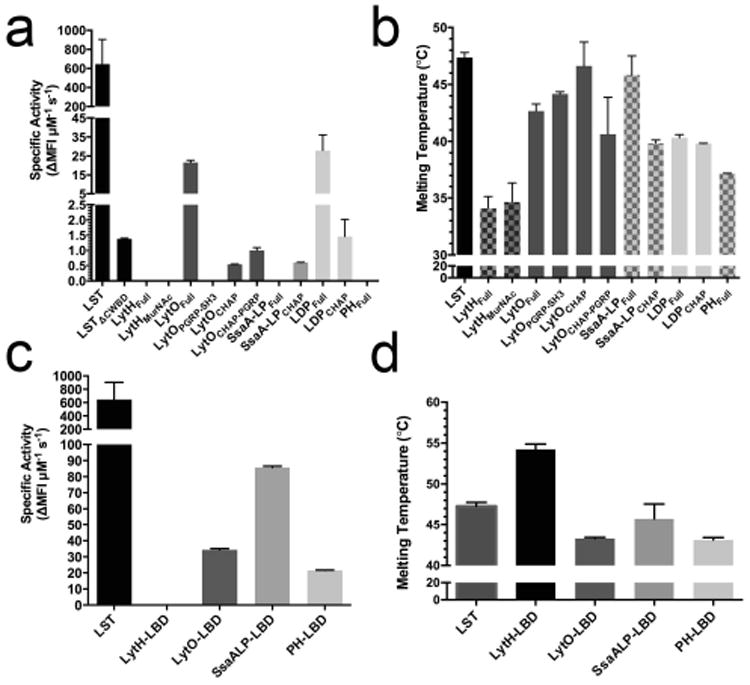
Fig. 2.

Preliminary characterization of autolysins and chimeras. A) Specific activities of the autolysins against live SA113 cells as measured by the SYTOX fluorescence kinetic assay. Lysins were tested up to 50 μg per 250 μL reaction. The LSTΔcwbd designation represents the LST's catalytic domain, for which kinetic data was previously published (Osipovitch, 2014). B) Melting temperatures of autolysins using differential scanning fluorimetry. C) Specific activity of chimeric lysins against live SA113 cells as determined by the SYTOX fluorescent assay. The LBD designation represents LST binding domain chimeras. LytH-LBD was tested up to 100 μg (14 μM), and the concentrations of the other enzymes were as follows: LytO-LBD=800 ng (100 nM), SsaALP-LBD=700 ng (100 nM), and PH-LBD=1250 ng (162 nM). D) Melting temperatures of chimeras. ΔMFI s-1 (change in mean fluorescence intensity per second) represents the slope of the steepest linear region of the lysis curve. All error bars represent standard deviations from two or more technical replicates.
