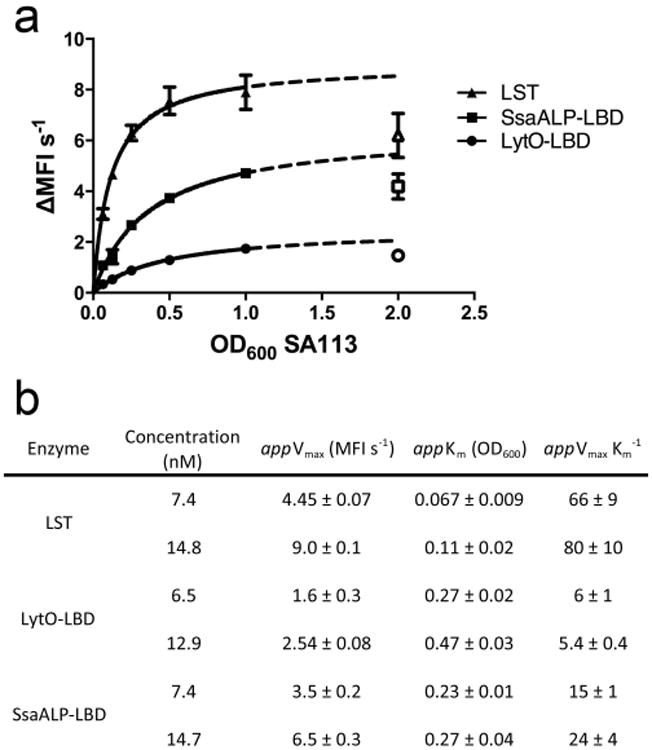
Fig. 3.

Pseudo-Michaelis-Menten kinetic analyses of LST and engineered autolysins. A) Curve fits used for determining pseudo-Michaelis-Menten constants. The dotted line represents an extrapolation of fit data, and the open shapes are values that were excluded in the curve fit. B) Table of apparent Michaelis-Menten parameters determined at two concentrations of each enzyme. Data are the means of triplicate measurements made in biological duplicate.
