
Fig. 6.
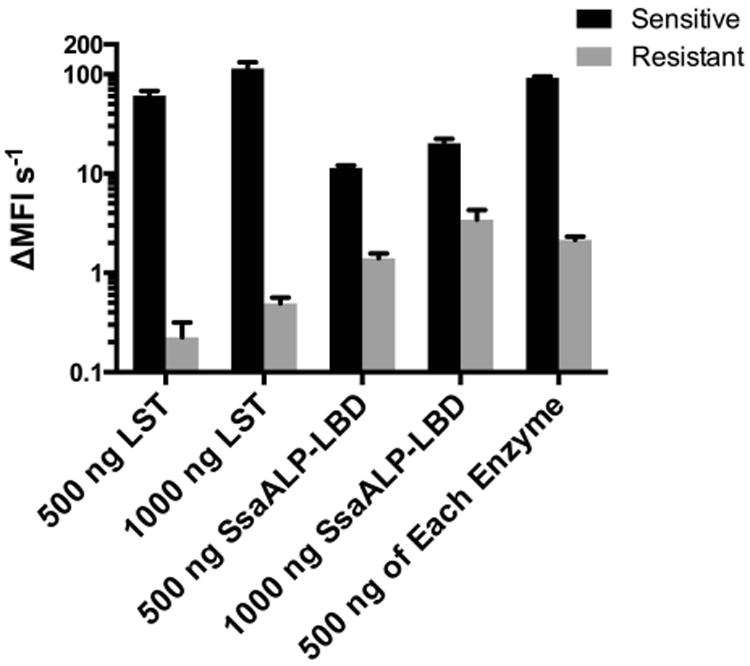
SsaALP-LBD lytic activity towards LST sensitive and resistant strains. Rate of lysis (change in mean fluorescence intensity per second), measured by a fluorescence assay, is shown for the LST-sensitive strain RN4220/PLI50 and the LST-resistant strain RN4220/PLI50∷end epr (Gargis 2010, DeHart 1995). Note the log-scale axis. For both enzymes, 500 ng and 1000 ng correspond to 0.07 and 0.15 μM, respectively. Values represent background subtracted means from triplicate measurements run in biological duplicate, with error shown as standard deviation.