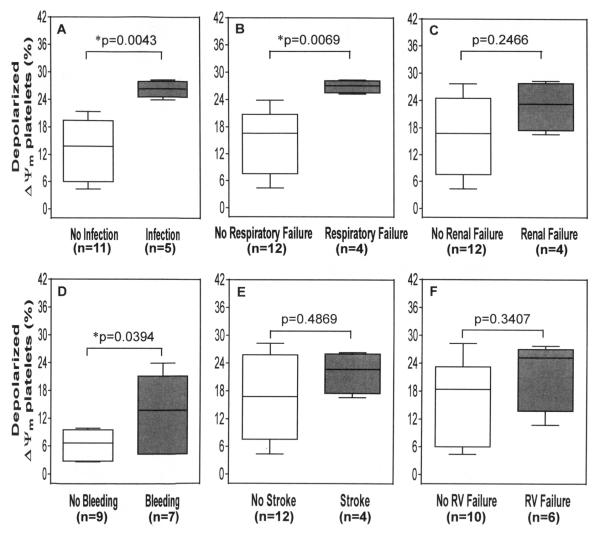
Figure 4.
The change in % depolarized ΔΨm platelets associated with different adverse events after CF LVAD implantation among the SIRS group. The lines across each box plot represent the median value. The lines that extend from the top and the bottom of each box represent the lowest and highest observations still inside the lower and upper limit of confidence. *p<0.05 is considered significant in Mann–Whitney U-test.

