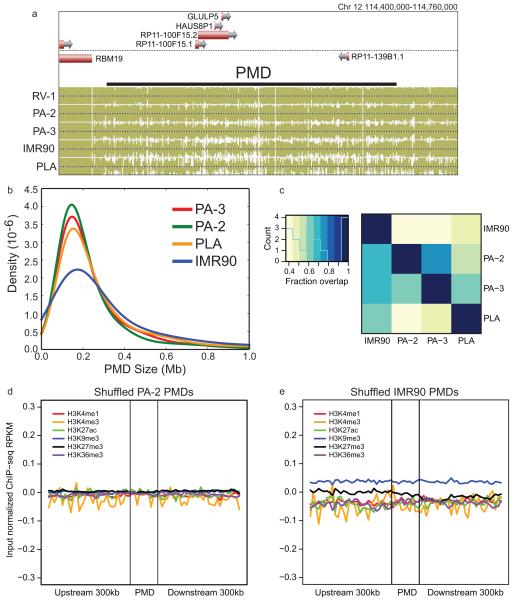
Extended Data Figure 6. PMD Features.
a, A browser screenshot (see Figure 1 for description) of an example PMD found in IMR90, PLA, PA-2, and PA-3. RV-1 is included as a representative sample without PMDs. b, The distribution of sizes of PMDs in various samples. c, A heatmap representation of the overlap between various sets of PMDs. The denominator of the fraction of overlap is determined by the sample on the y-axis. d-e, ChIP-seq profiles of the PMD regions defined in PA-2 (c) and IMR90 (d) after shuffling.

