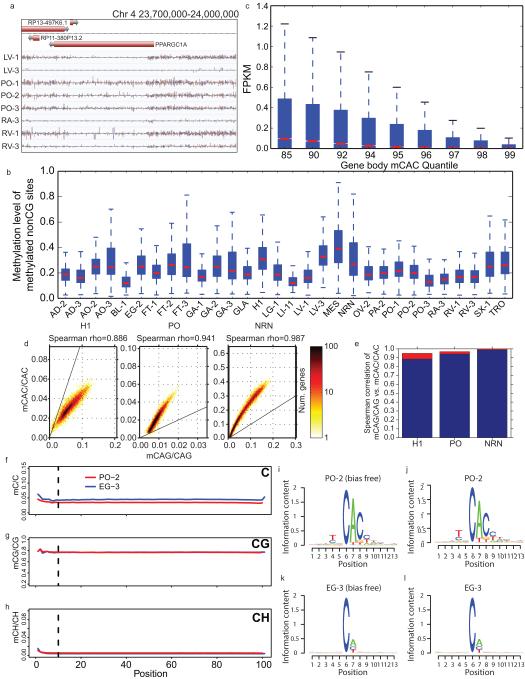
Extended Data Figure 8. mCH distribution and correlation.
a, A browser screenshot (see Figure 1 for description) of an example region with non-CG methylation (mCH). Purple and pink ticks are methylated CHG and CHH sites, respectively (H = A, C, or T). Ticks on the forward strand are projected upward from the dotted line and ticks on the reverse strand are projected downward. b, The distribution of methylation levels at mCH sites across all samples with a discernible TNCAC motif. Only mCH sites with at least 10 reads and a significant amount of methylation were considered. c, Boxplots of the expression values across different quantiles of CAC gene body methylation (Gene body mCAC). d, Scatterplot of mCAG vs. mCAC inside gene bodies. e, Bar plot of the correlation of mCAG and mCAC inside gene bodies (blue) and the theoretical maximal correlation (red) if mCAC and mCAG are perfectly correlated. f-h, The methylation levels of C (upper panel), CG (middle panel) and CH (lower panel) across the read positions for PO-2 (red line) and EG-3 (blue line). Vertical lines indicate the position (10th base from the beginning) where trimming was applied. i, mCH motif from PO-2 with the first 10 bases of each read trimmed. j, mCH motif from PO-2 without trimming. k, mCH motif from EG-3 with the first 10 bases of each read trimmed l, mCH motif from EG-3 without trimming. The height of each letter represents its information content (i.e., prevalence).

