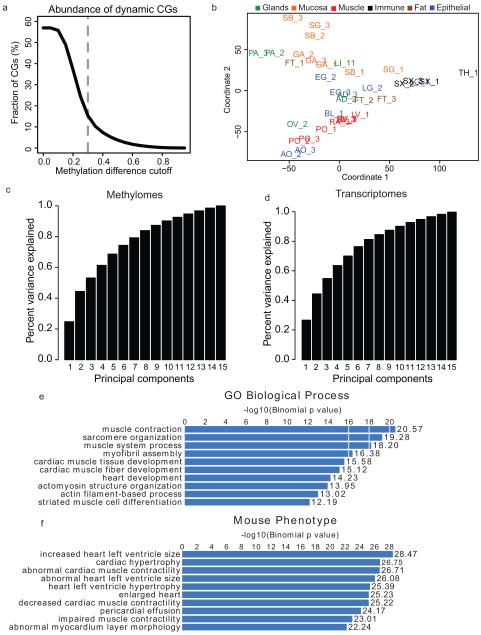
Extended Data Figure 1. Identification of differentially methylation regions (DMRs) and Multidimensional Scaling Analysis.
a, Line plot showing the fraction of differentially methylated CG sites (DMSs, dynamic CGs) out of all CG sites under various methylation difference cutoffs. The methylation difference of a CG site is defined in Ziller et al.2 b, A plot of the first two principal components from the methylation level multi-dimensional scaling. Tissues are shaded by the organ group they belong to as in Figure 1c and 1d. c-d, Bar charts of the cumulative amount of variance explained by the first N principal components from the multi-dimensional scaling performed on the methylation levels of all DMRs (c) and the expression levels of all differentially expressed genes (d). e, A representative example of enriched GO biological process terms based on the most hypomethylated DMRs from LV-1. f, A representative example of enriched mouse phenotype terms based on the most hypomethylated DMRs from LV-1.

