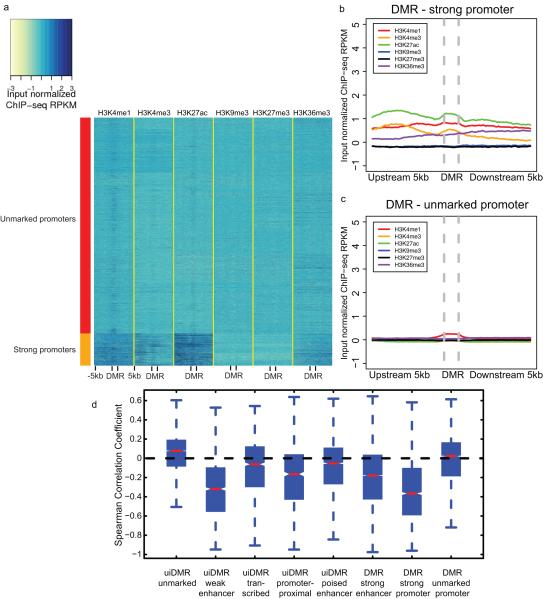
Extended Data Figure 4. Classification of promoter histone profiles.
a, A heatmap of the histone modification profiles across strong (rows labeled with red) and unmarked (rows labeled with orange) promoters. The profiles were plotted for each mark across the promoter and the 5kb upstream and downstream and the colors of each cell indicate the input normalized ChIP-seq RPKM. b-c, The aggregate profiles for strong and unmarked promoters (b) and (c), respectively. d, The distribution of the Spearman correlation coefficients between the methylation level of different types of hypomethylated intragenic DMRs and the expression of the nearest gene. Notches indicate a confidence interval estimated from 1,000 bootstrap samples.

