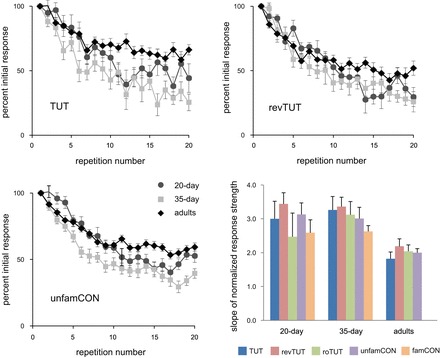
Fig. 5.

Rate of habituation to different song types as a function of age. Top right and left and bottom left: mean ± SE normalized response strength for each stimulus iteration for TUT, revTUT, and unfamCON, respectively. Bottom right: mean + SE slope of linear regression between normalized response strength and iteration number for each song type in each age group.
