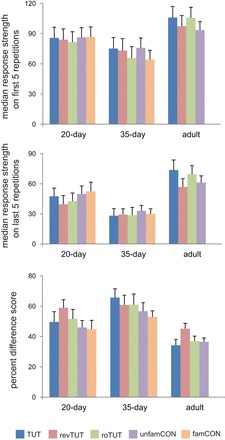
Fig. 6.

Raw response strength in dorso-caudal NCM on the first five vs. the last five stimulus iterations. Top and middle: median raw response strength of the first five (top) and last five (middle) stimulus repetitions of each song type. Bottom: normalized difference score showing the percent decrease between the first five and the last five stimulus repetitions for each song type. All values are means + SE.
