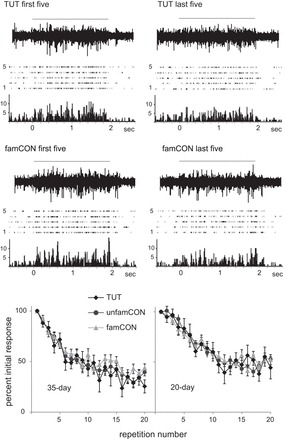
Fig. 8.

Comparison of habituation to TUT vs. famCON in NCM of a 35-day-old bird. Top: each panel shows, from top to bottom, an example of a raw trace, a raster of 5 trials, and a peristimulus time histogram (PSTH). Top two panels show decrease in response strength from first five to last five repetitions for TUT; middle two panels show decrease in response strength from first five to last five repetitions for familiar CON song. Gray lines at top show timing of song playback; duration of both TUT and famCON was 2 s; bin size for PSTHs was 12.5 ms. Bottom: rate of habituation to TUT, famCON, and unfamCON in 35- (left) and 20-day-old (right) birds. Values are means ± SE normalized response strength for each stimulus iteration.
