
FIG. 6.
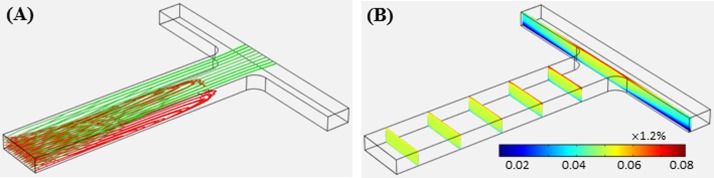
Isometric view of the numerically predicted 3D particle trajectories ((a), red and green lines are for diamagnetic and magnetic particles, respectively) and ferrofluid concentration contour ((b), over a series of cross-sectional slices) for simultaneous diamagnetic and magnetic particle trapping in ferrofluid flow through the T-shaped microchannel under a volume flow rate of 40 μl/h. Note that the bulk ferrofluid concentration far away from the T-junction is 0.05 × 1.2%.