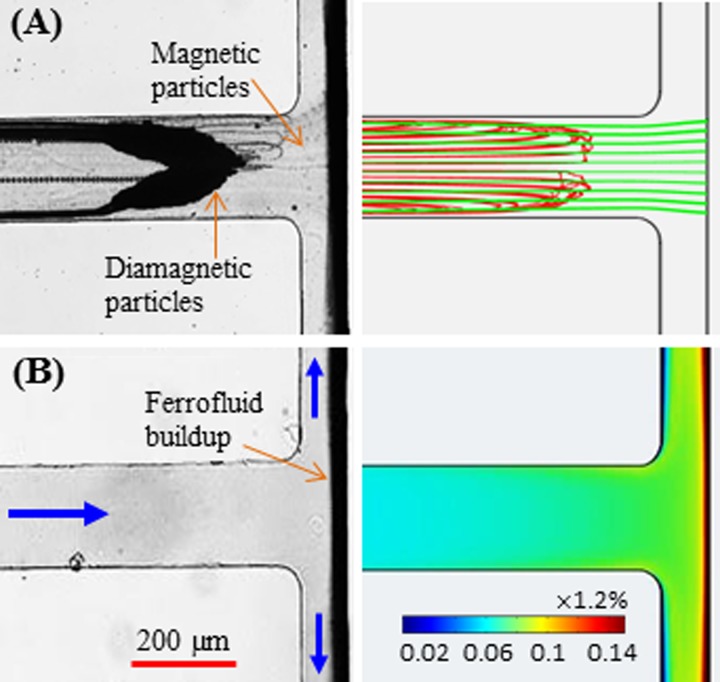
FIG. 7.
Comparison of top-view experimental images (left column) and numerical predictions (right column) for simultaneous diamagnetic/magnetic particle trapping (a) and ferrofluid nanoparticle buildup ((b), in the absence of microparticles) at the T-junction region of the microchannel. The focal plane of the microscope objective is in the middle of the channel depth. The volume flow rate is 55 μl/h in the experiment and 40 μl/h in the simulation. Note that the bulk ferrofluid concentration far away from the magnet is 0.05 × 1.2%. The block arrows in (b) indicate the flow directions.

