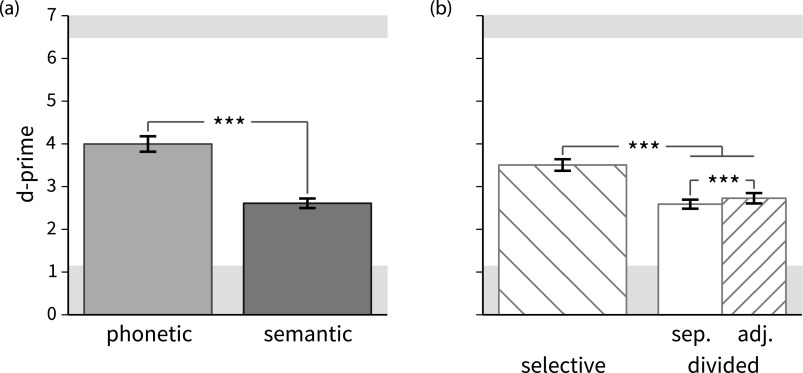
FIG. 2.
Barplots of mean listener sensitivity (d ′ scale) ± 1 standard error of the mean for the main effects trial type and attentional configuration. Background shading indicates chance and ceiling performance levels. Brackets indicate the presence of corresponding coefficients in the statistical model that are significantly different from zero; * indicates p < 0.05, ** indicates p < 0.01, *** indicates p < 0.001. (a) Main effect of trial type (phonetic versus semantic trials). The difference corresponds to the significant model coefficients target:semantic (indicating better target detection in phonetic trials) and foil:semantic (indicating a higher tendency in the phonetic condition to incorrectly identify of foil items as targets). (b) Main effect of attentional configuration (selective attention to one stream versus divided attention to two streams). The selective versus divided difference (upper bracket) corresponds to the significant model coefficients target:selective (indicating better target detection in selective attention trials), and foil:selective (indicating higher tendency in divided attention trials to incorrectly respond to foil items). The adjacent versus non-adjacent difference (lower bracket) corresponds to the significant model coefficient foil:adjacent (indicating higher tendency in spatially non-adjacent divided attention trials to incorrectly respond to foil items).

