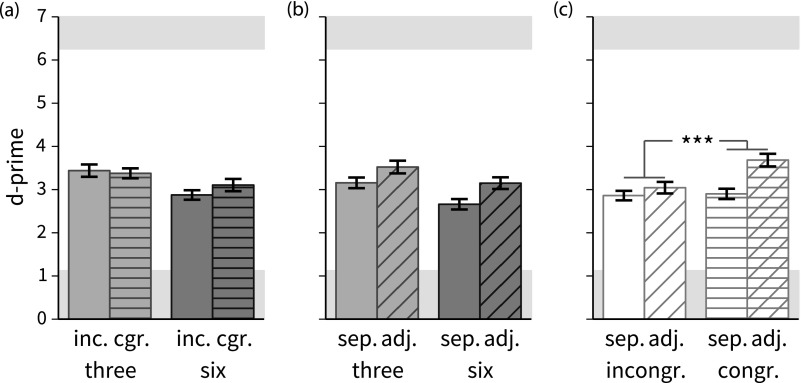
FIG. 6.
Barplots of mean listener sensitivity (d ′ scale) ± 1 standard error of the mean for the interactions among size, congruence, and adjacency. Background shading indicates chance and ceiling performance levels. Brackets indicate the presence of corresponding coefficients in the statistical model that are significantly different from zero; * indicates p < 0.05, ** indicates p < 0.01, *** indicates p < 0.001. (a) Plot of interaction between size (3- versus 6-word categories) and congruence (same versus different categories in attended streams). None of the relevant model coefficients (target:three:congruent and foil:three:congruent) are statistically significantly different from zero. (b) Plot of interaction between size and adjacency (attended streams spatially separated or adjacent). None of the relevant model coefficients (target:three:adjacent and foil:three:adjacent) are statistically significantly different from zero. (c) Plot of interaction between congruence and adjacency. The positive model coefficient target:adjacent:congruent and negative coefficient foil:adjacent:congruent indicate better target detection and fewer responses to foils when attended streams are both adjacent and congruent.

