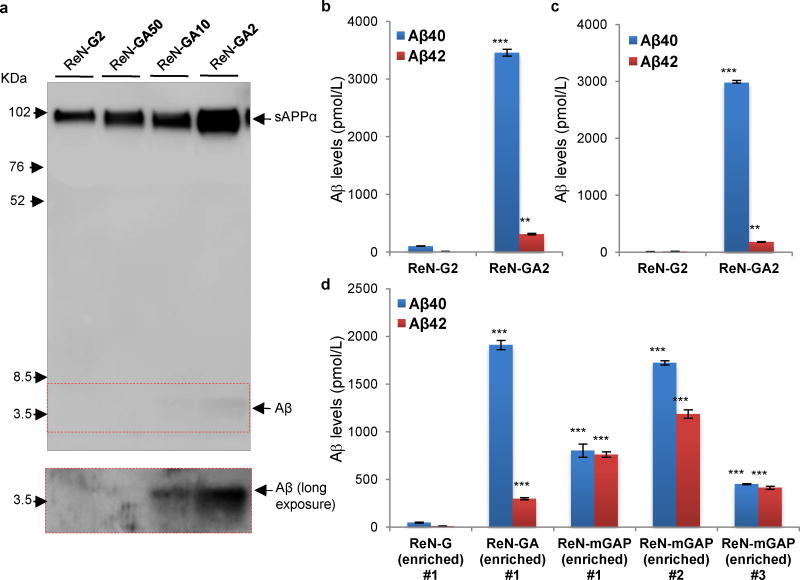
Figure 5. Analysis of soluble Aβ levels in the enriched FAD ReN cells by Western Blot and Aβ ELISA.
a. Western Blot of Aβ levels in the conditioned medium collected from undifferentiated enriched ReN-G and -GA cells. The conditioned medium was collected from T25 flask after culturing the cell for 2 days. 6E10 anti-Aβ detected ~4 kDa Aβ monomer bands in the media collected from the enriched FAD ReN cells (ReN-GA10, ReN-GA2). The 6E10 antibody also detected sAPPα (~100 kDa), which would represent the amount of full-length APPs in these cell lines. b. Increased Aβ40 and 42 levels in undifferentiated FAD ReN-GA2 cells, detected through Aβ ELISA (***, p<0.001; Student t-test; n=3 per each sample). c. Increased Aβ40 and 42 levels were also detected in a conditioned media collected from 1-week old thick-layer 3D cultures of ReN-GA2 cells (***, p<0.001; Student t-test; n=3 per each sample). The soluble Aβ levels cannot be directly compared to the levels shown in (b) since the total cell numbers of thick-layer cultures are higher than 2D undifferentiated cultures used in (b). d. Soluble Aβ levels of the various enriched FAD ReN cells. The FAD cells with PSEN1ΔE9 showed elevated Aβ42/40 ratio as compared to the enriched ReN-GA cells.

