Figure 3.

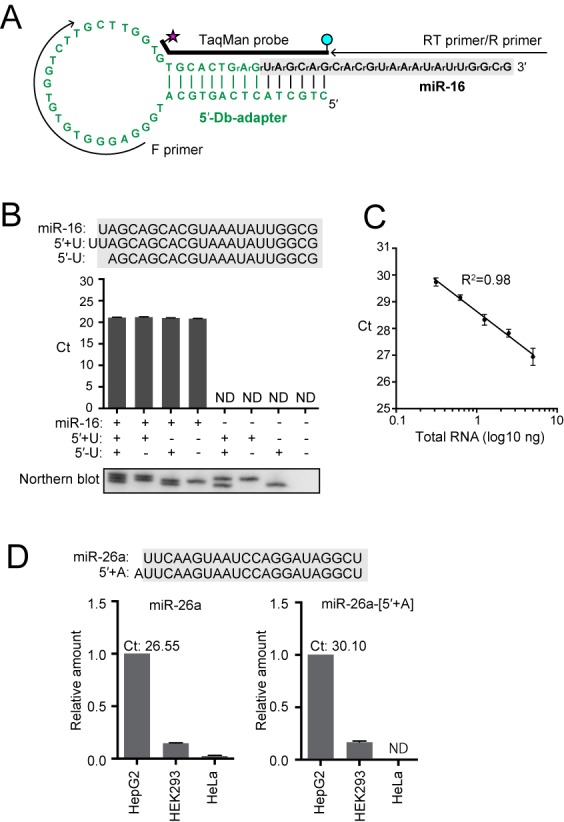
5′-Db-PCR to quantify specific 5′-variants of small RNAs. (A) Sequences and secondary structures of the 5′-Db-adapter (green) and targeted human miR-16 (black). The 5′-Db-adapter contains two 3′-terminal RNA nucleotides, whereas all other parts of the adapter consist of DNA. The regions from which primers and TaqMan probe were derived are shown. (B) 5′-Db-PCR was applied for the detection of synthetic miR-16 and its 5′-variants whose sequences are shown above. miR-16 but not its 5′-variants was specifically amplified by 5′-Db-PCR. The data represents the average Ct values from three independent experiments with bars showing the SD. Northern blot detection of the quantified RNAs is shown below. (C) Proportional correlation of HeLa total RNA input (0.313, 0.625, 1.25, 2.5 and 5 ng) to the Ct value obtained by 5′-Db-PCR. Each data set represents the average of three independent experiments with bars showing the SD. (D) 5′-Db-PCR was applied for the detection of human miR-26a and miR-26a-[5′+A], a 5′-isomiR of miR-26a containing an additional A residue at its 5′-end, in HepG2, HEK293 and HeLa cell lines. The abundance in HepG2 cells was defined as 1, and the average of the relative abundance from three independent experiments are shown with SD bars. The average Ct values of miR-26a and miR-26a-[5′+A] from HepG2 cells were 26.55 and 30.10, respectively.
