
Figure 2.
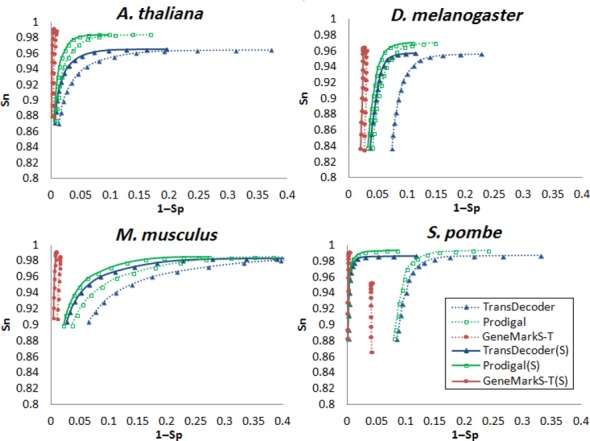
Plots of gene prediction sensitivity (Sn) as functions of gene prediction specificity (1 − Sp) for TransDecoder, Prodigal and GeneMarkS-T determined on test sets of ‘complete’ reference transcripts of A. thaliana, D. melanogaster, M. musculus and S. pombe. We applied the three tools in both strand blind and strand informed (S) modes. To build the curves we generated sets of predicted genes with minimal length controlled by the mgl threshold (see text). As the mgl values increased from 90 to 480 bp (with 30 bp step) the Sn values decreased.