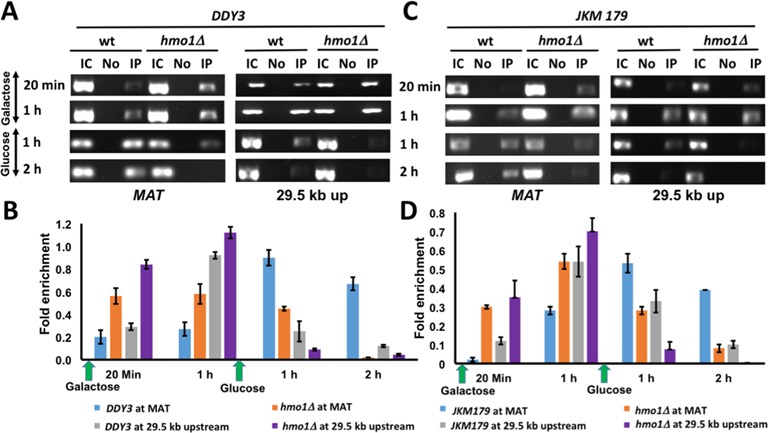
Figure 3.

H2A phosphorylation. (A) ChIP with DDY3 WT and corresponding hmo1Δ strain using antibody to phosphorylated H2A at MAT and at 29.5 kb upstream of DSB during DNA damage (galactose) and repair (glucose). IC, input control; No, no antibody; IP, immunoprecipitation with antibody to γ-H2AX. (B) Densitometric analysis of ChIP data shown in (A), obtained with ImageJ software. (C) ChIP with JKM179 WT and corresponding hmo1Δ strain using antibody to phosphorylated H2A at MAT and at 29.5 kb upstream of DSB during DNA damage (galactose) and repair (glucose). (D) Densitometric analysis of ChIP data shown in (C). Fold enrichment = ChIP/Input DNA. Three independent experiments were performed. Error bars represent standard deviation.
