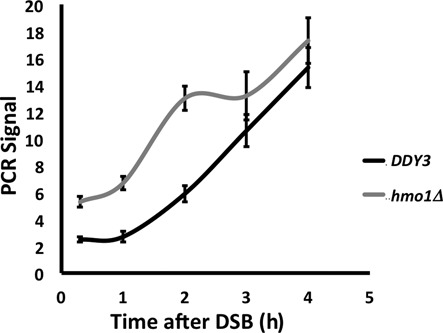
Figure 6.

Quantification of DNA resection by qPCR. PCR products were amplified after Exonuclease I treatment of genomic DNA isolated at the indicated times following DSB induction using primers that anneal 1.6 kb upstream of the DSB. All values were normalized to that for an independent locus (POL5). DNA resection was measured in DDY3 and the corresponding hmo1Δ strain.
