
Figure 2.
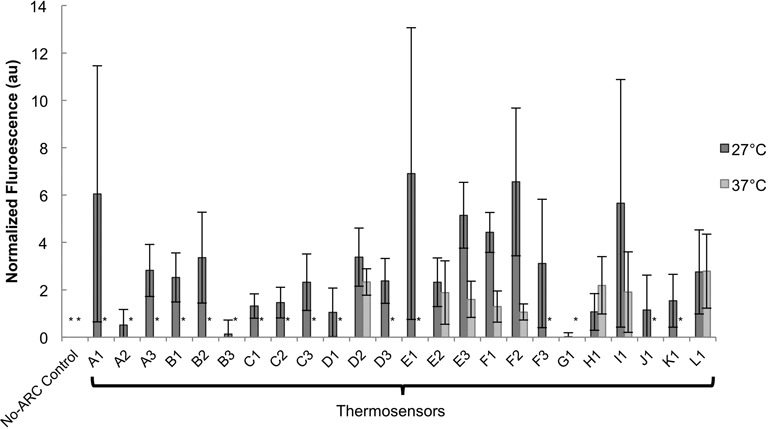
Thermosensor response in E. coli DH10B. Normalized fluorescence of thermosensors at 27 and 37°C is shown (see Supplementary Figure S3 for raw data, without normalization applied, including data for an intermediate temperature at 32°C). Fluorescence was normalized to pTet-GFP output at each temperature (1 ng/ml aTc). The asterisk (*) indicates that the GFP/Abs value was within one standard deviation of the DH10B GFP/Abs value (Materials and Methods section). This means that expression was completely ‘off’ and that these thermosensors are not leaky at 37°C. As expected, the No-ARC control is completely ‘off’ at both temperatures. Data is the average of six biological replicates, over two different days. Error bars represent standard error of the mean (SEM). A one-tailed, unpaired, Student's t-test was performed to see if expression was significantly higher at 27°C than at 37°C. The increase in fluorescence was significant for the A3, B1, C1, E3 and F1 thermosensors (P < 0.05). If the criterion is relaxed, the increase in expression at 27°C from the B2, D3 and F2 thermosensors (P < 0.07) as well as the K1 thermosensor (P < 0.09) can also be considered significant. Thermosensors A1, A2, C2, C3, D1, D2, E1, F3, G1 and H1 had P-values <0.25, and thermosensors B3, E2, I1, J1 and L1 had P-values >0.25.