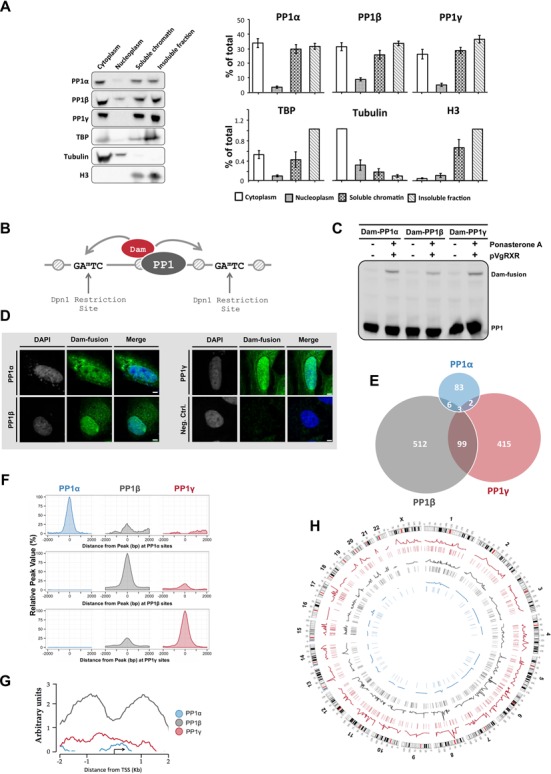
Figure 1.

PP1 isoforms bind to distinct promoter subsets. (A) HeLa cells were fractionated by differential centrifugation into cytoplasmic, nucleoplasmic as well as nuclease-solubilized (soluble) and insoluble fractions. All fractions were diluted to the same volume and processed for immunoblotting with isoform-specific PP1 antibodies. TATA-binding protein, α-tubulin and histone H3 served as markers. The left panel shows a representative blot. The right panel shows the average of scans ± S.E.M. of four independent experiments. The protein levels are given as percentages of the total protein pool. (B) Fusions of Dam and PP1 that are targeted to specific chromatin regions methylate flanking adenines in a GATC sequence, which can be mapped using methylation (un)specific restriction enzymes, PCR-amplification and DNA microarray analysis. (C) Expression of the Dam-PP1 fusions after their transient induction with Ponasterone A in HeLa cells. (D) Subcellular localization of the Ponasterone-A induced Dam-PP1 fusions in HeLa cells. (E) Venn diagram showing the significant binding peaks and overlapping peaks of each PP1 isoform on the promoter regions. The area of the circles and overlaps correlates with the number of peaks. In the majority of cases one peak translates to one promoter but multiple peaks can also occupy a single promoter. (F) Global signal profiles of the PP1 isoforms at −2/+2 kb of the peak centers. The percentages of the PP1 signals were calculated according to the highest signal found across the binding sites. The graphs were drawn using the R package ggplot2 (53). (G) The average raw signal profile of the PP1 isoforms on promoter regions, as calculated with the SitePro tool from the CEAS package (43). (H) Circos plot (version 0.61) of the significant PP1 promoter binding peaks across the HeLa genome (54). The line profiles of the PP1 isoforms reflect the intensity of the isoform binding signals. The lines underneath the line profiles denote the position of the significant binding sites.
