
Figure 5.
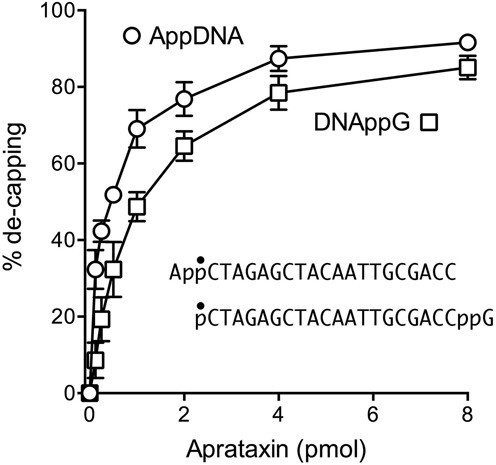
5′ de-adenylylation versus 3′ de-guanylylation. Reaction mixtures (10 μl) containing 50 mM Tris–HCl (pH 8.0), 40 mM NaCl, 5 mM EDTA, 0.2 pmol 5′ 32P-labeled AppDNA or pDNAppG substrates (of identical nucleobase sequence, as shown, with the radiolabeled phosphate denoted by •) and either 0.125, 0.25, 0.5 1, 2, 4, 8 pmol of aprataxin were incubated at 30°C for 10 min. The products were analyzed by urea-PAGE. The extents of conversion of pDNAppG to pDNAp and of AppDNA to pDNA are plotted as a function of input aprataxin. Each datum in the graph is the average of four or five independent experiments ± SEM.