
Figure 3.
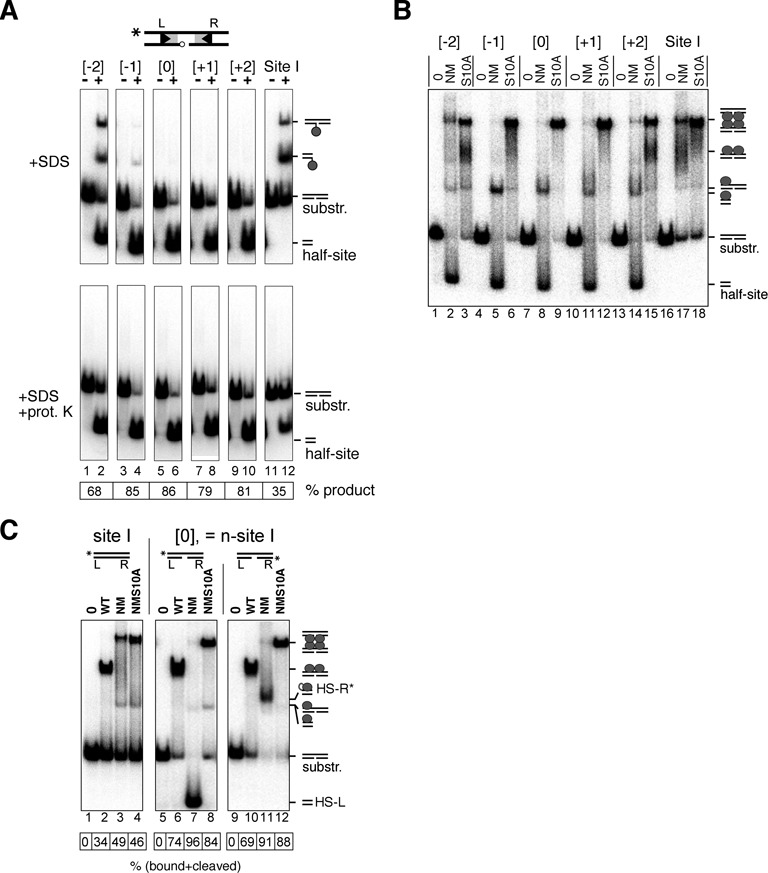
Binding, synapsis and cleavage of nicked-site I substrates by Tn3 resolvase. (A) Substrates (50 bp; 50 nM) were 5′-32P-labelled at the left end on the top (intact) strand. They were then treated with the activated Tn3 resolvase variant NM (400 nM) at 37°C for 30 min. Reactions were stopped by treatment with 0.1% SDS, and products were separated on a 7.5% polyacrylamide gel. The samples in the lower panels were additionally treated with 1 mg/ml protease K prior to electrophoresis. These data were quantitated to give % conversion to half-site product (shown in the box below the gel). The positions of the nicks in the sites designated −2, −1, 0, +1 and +2 are shown in Figure 2A. Assignment of product bands is indicated by the small cartoons on the right of the gel. The reactions leading to these products are illustrated in more detail in Figure 2B. (B) Binding, synapsis and cleavage of nicked-site substrates. Substrates (50 bp; 50 nM), labelled as in part (A), were treated with NM resolvase or its catalytically defective mutant NM S10A (both 800 nM), and complexes were separated on a non-denaturing polyacrylamide gel. Complexes with resolvase and reaction products are indicated by the small cartoons to the right of the gel. (C) Following the fate of the left and right ends of n-site I. The site I or n-site I substrate (50 bp; 50 nM) was 32P-labelled at the left or the right end as indicated by the asterisk in the cartoons above the relevant lanes. The substrates were then treated with resolvase and separated as in part (B). The data were quantitated to give % substrate bound and/or reacted (box below the gel).