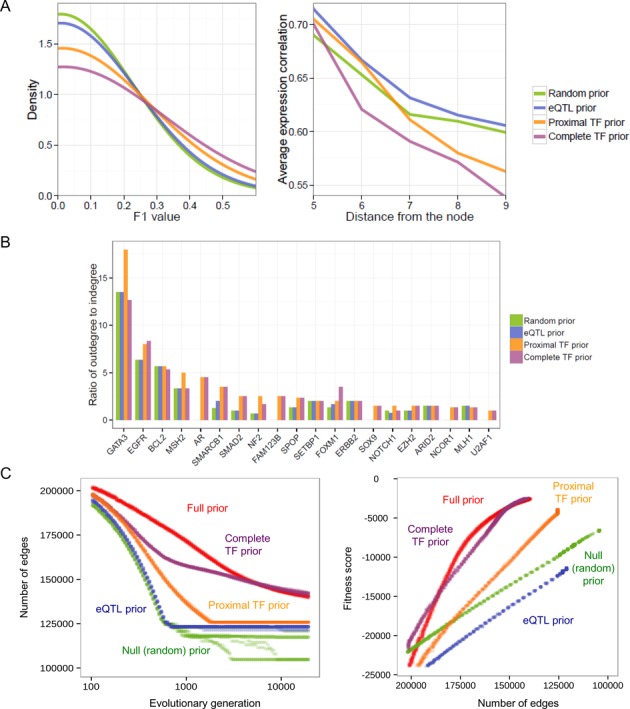
Figure 2.

Quantitative prior evaluation. (A) Evaluation of four different test networks built on four different prior subsets. (Left) Distribution of the F1 scores for edges in a key breast cancer subnetwork as calculated by interrogating a manually curated and peer-reviewed pathway database. (Right) The average gene expression correlation of a node with other nodes at a varying network distance. (B) Ratio of the outdegree to indegree of TF nodes in the tested subnetworks. (C) Global network performance of four partial prior models. Convergence patterns were observed in 10 independent GA runs that used each prior subset by tracing the number of recovered edges according to the number of GA generations (left) and by tracing the fitness score according to the number of edges (right).
