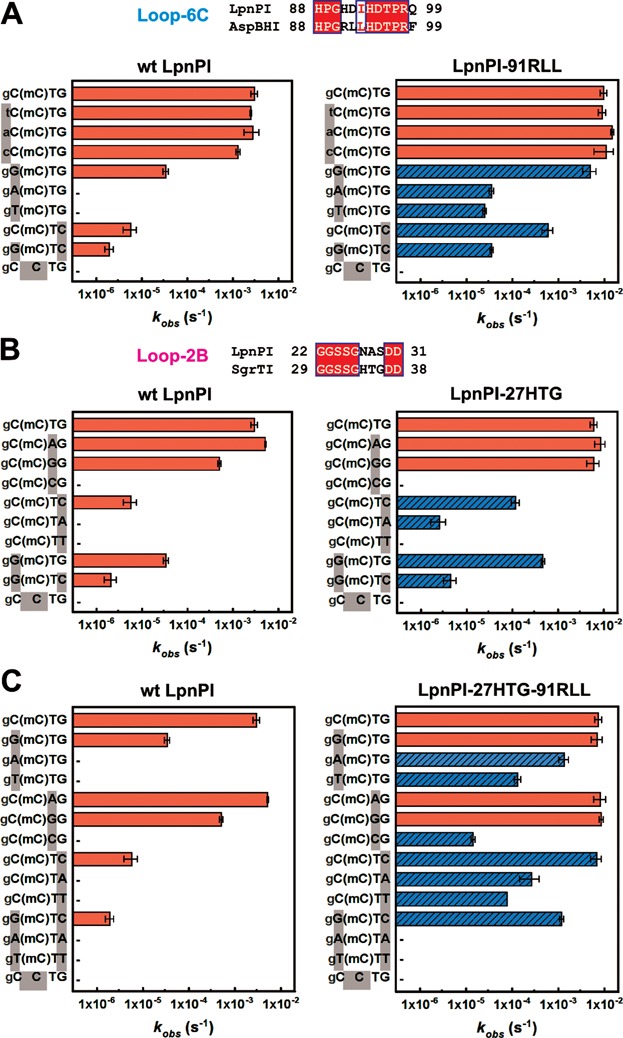
Figure 3.

Recognition site preference of LpnPI. Oligoduplex DNA cleavage reactions were performed under standard reaction conditions and the observed rate constants kobs were determined by single-exponential fits (see Materials and Methods for details). The recognition sequences of the DNA substrates are shown on the left-hand side of the graphs. ‘(mC)’ stands for 5mC (the last substrate in each graph is the unmethylated control); sequence positions that differ from the reference ‘gC(mC)TG’ substrate are marked with grey boxes; full oligoduplex sequences are listed in Table 3. The reaction rates of LpnPI mutants that show increased cleavage due to loop replacement are marked by blue streaked bars; ‘−’ marks undetectable cleavage (rate lower than 3 × 10⁻⁷ s−1, the starting position of the x-axis). Alignments of the LpnPI/AspBHI Loop-6C and the LpnPI/SgrTI Loop-2B that were replaced in the LpnPI-91RLL and LpnPI-27HTG are shown above panels A and B, respectively. (A) Wt enzyme and the LpnPI variant LpnPI-91RLL (Loop-6C replacement) on DNA substrates with variable sequence upstream and downstream of 5mC. (B) Wt enzyme and the LpnPI variant LpnPI-27HTG (Loop-2B replacement) on DNA substrates with variable sequence upstream and downstream of 5mC. (C) Wt enzyme and the ‘double-swap’ LpnPI variant LpnPI-27HTG-91RLL on DNA substrates with variable sequences upstream and downstream of 5mC.
