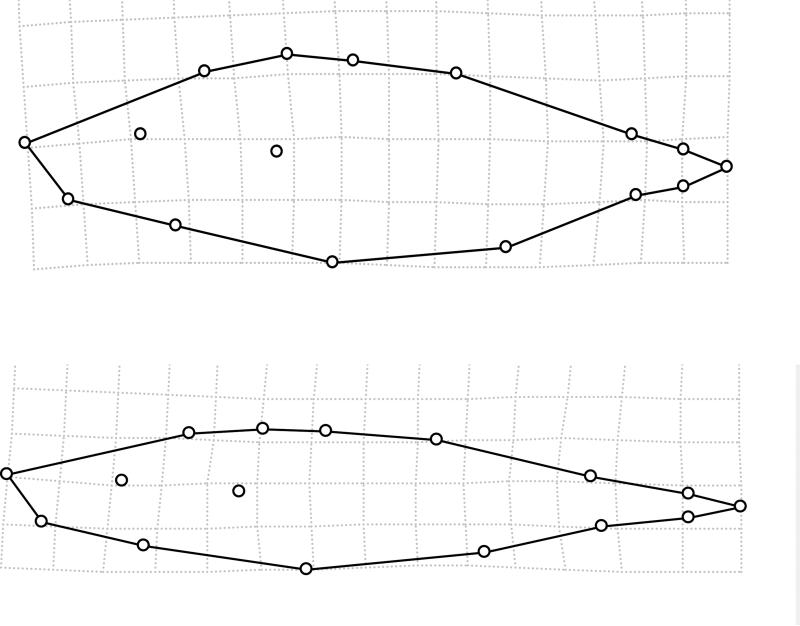
Figure 4.
Variation in body depth captured by relative warp 1, with a lower score (more stream-like) shown on top and a higher score (more lake-like) shown on the bottom. The illustrated deformations represent the maximum (Pye Lake) and minimum (Village Bay Inlet Stream) population averages (see Fig. 5).

