
Fig. 10.
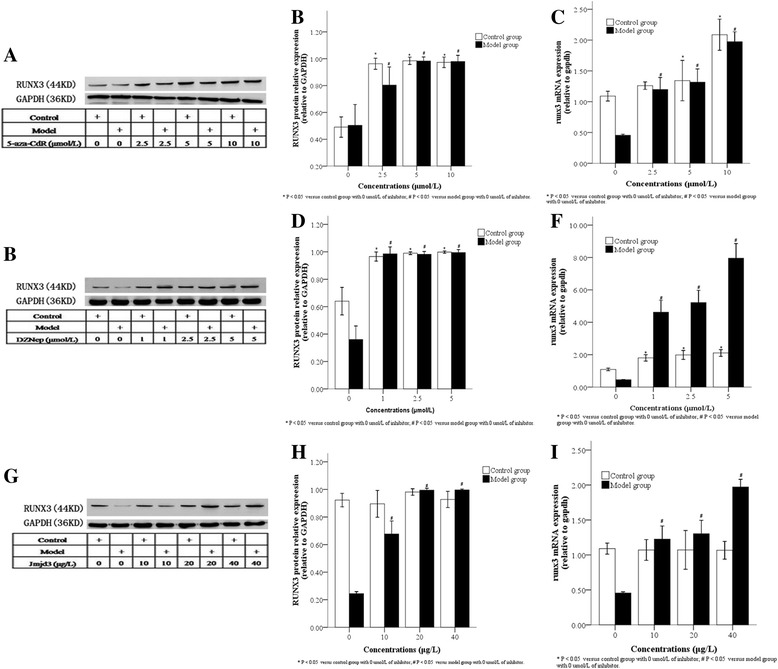
RUNX3 protein and mRNA levels in AT2 cells after 48 h treatment with different concentrations of inhibitors. Cells from control and model groups were treated with various inhibitors. As detected by Western blot, RUNX3 protein expression in AT2 cells from both control and model groups increased after 48 h treatment with different concentrations of 5-Aza-CdR (a and b, 2.5, 5, 10 μmol/L), DZNep (d and e, 1, 2.5, 5 μmol/L) or JMJD3 (g and h, 10, 20, 40 μg/L). As detected by real-time PCR, RUNX3 mRNA expression in AT2 cells from both control and model groups increased after 48 h treatment with different concentrations of 5-Aza-CdR (c), DZNep (f) or Jmjd3 (i). *P < 0.05 vs. control group; #P < 0.05 vs. model group, n = 4