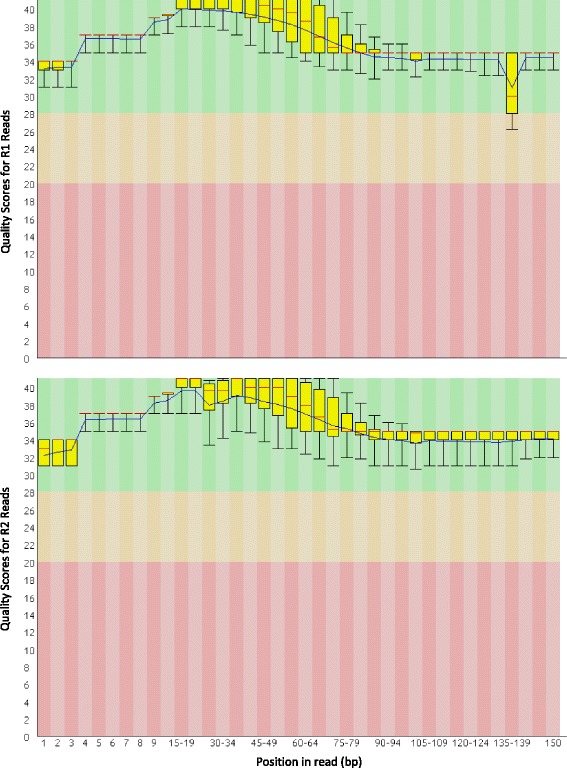
Fig. 2.

Per base quality scores for sequencing reads after quality filtering. Per base quality scores from the FastQC analysis of R1 (above) and R2 (below) sequencing reads from the control group’s gill tissue cDNA library after quality filtering and trimming. These figures are representative for all libraries showing high quality scores at all bases, with the exception of bases 135–140 in the R1 (above) sequences. This reduction in quality scores was seen for all four libraries and indicates an artefact of the sequencing run. Yellow boxes = 25 – 75 % interquartile range; whiskers = 10 – 90 %; red lines = median; blue line = mean
