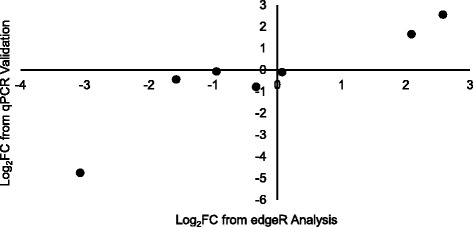
Fig. 6.

Validation of edgeR differential expression results with qPCR. Log2-fold changes from the edgeR differential expression analysis (x-axis) were highly correlated with log2-fold change values from quantitative real-time PCR (qPCR; y-axis). Log2-fold changes are relative to the control group. The seven data points represent three genes (hsp90, egl9, and hemocyanin) and four transcripts (rpl, got2, sdr1, ugt1)
