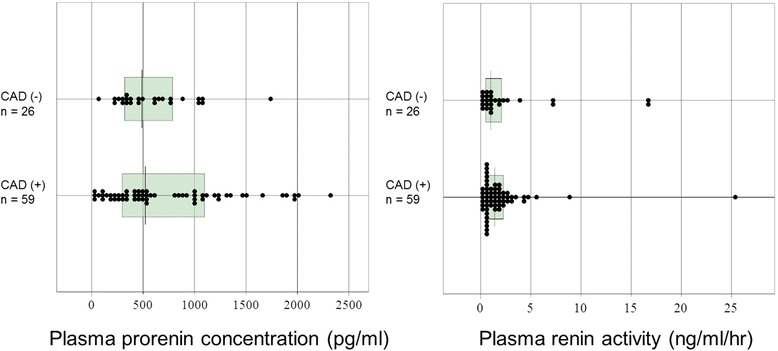
Fig. 2.

Plasma prorenin concentrations and renin activity in coronary artery disease and non- coronary artery disease groups. Non-parametric data are shown in box plots. A line in each box indicates the median. The upper and lower limits of each box are the 1st and 3rd quartiles, respectively
