
Fig. 3.
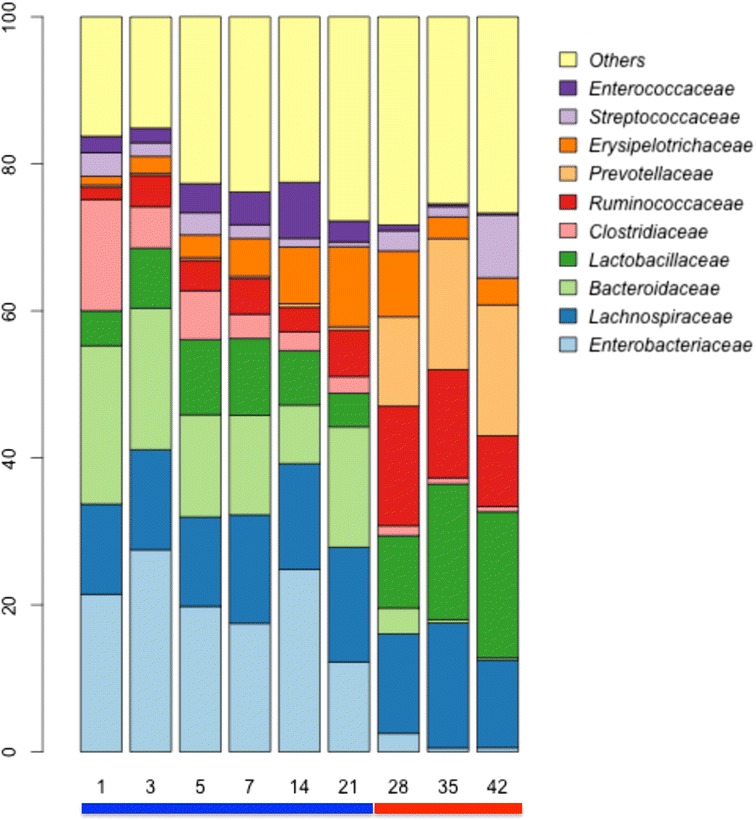
Stacked bar plots showing average percentage of bacterial populations in pig feces over time, from left to right, at day 1, 3, 5, 7, 14, 21, 28, 35, and 42. Colored bars below plot indicate diet (blue, nursing; red, weaned)
Official websites use .gov
A
.gov website belongs to an official
government organization in the United States.
Secure .gov websites use HTTPS
A lock (
) or https:// means you've safely
connected to the .gov website. Share sensitive
information only on official, secure websites.
Stacked bar plots showing average percentage of bacterial populations in pig feces over time, from left to right, at day 1, 3, 5, 7, 14, 21, 28, 35, and 42. Colored bars below plot indicate diet (blue, nursing; red, weaned)