Fig. 6.

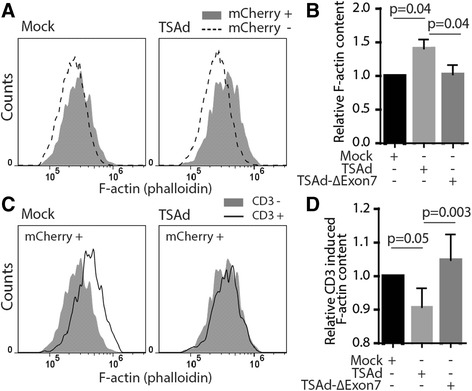
TSAd promotes F-actin polymerization in T cells. Actin polymerization in TSAd-mCherry transfected JTAg cells was quantified with imaging flow cytometer. a Histograms of F-actin intensity (phalloidin) in mCherry+ popoulation versus mCherry- population transfected with mCherry empty vector (mock, left histogram) and TSAd WT-mCherry (right histogram). One representative of five experiments is shown. b Graph shows relative amount of F-actin in resting cells shown in (a). Mean ± SD (n = 5) and p-values from 2-tailed paired t-test. c Overlay of histograms of F-actin intensity in non-stimulated and anti-CD3 (OKT3) stimulated cells for mock and TSAd WT transfected cells. Results shown are one representative of five independent experiments. d Graph shows relative change in F-actin content in anti-CD3 stimulated cells. Relative change of F-actin content in anti-CD3 stimulated mock transfected cells was set to 1. Data shown are means ± SD of three independent experiments. P-values estimated by a 2-tailed paired t-test
