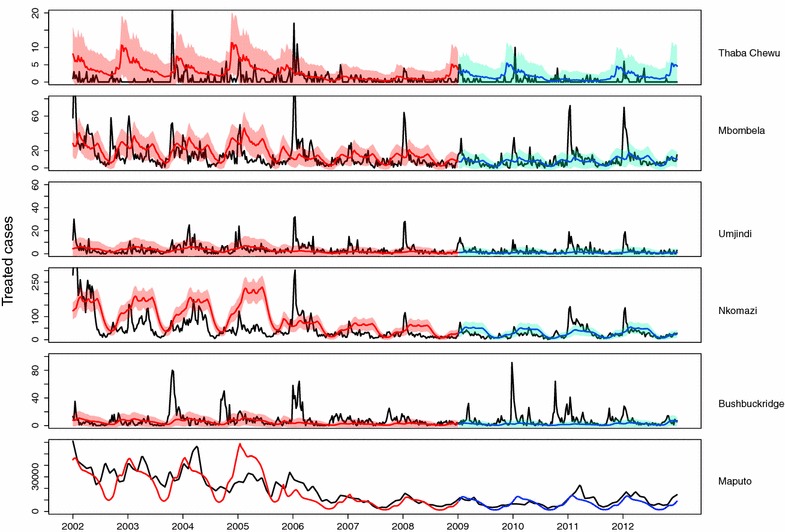
Figure 4.

Predicted weekly treated cases (blue 2002–2008; red 2009–2012) fitted to and validated with data (black). The 95% uncertainty range for weekly case predictions is shown.

Predicted weekly treated cases (blue 2002–2008; red 2009–2012) fitted to and validated with data (black). The 95% uncertainty range for weekly case predictions is shown.