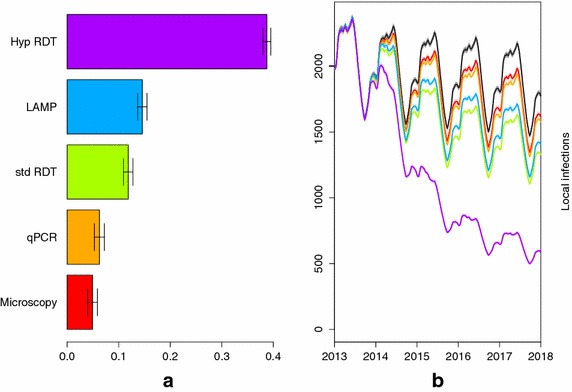
Figure 5.

Predicted impact due to FSAT between 2014 and 2018 using the following diagnostic tools: microscopy (red), qPCR (orange), RDT (green), LAMP (blue) and a hypothetical RDT (purple). a Shows the percentage decrease in local infections due to the FSAT and b shows the impact of FSAT on local infections in Ehlanzeni district through time compared to the base case of no interventions (black).
