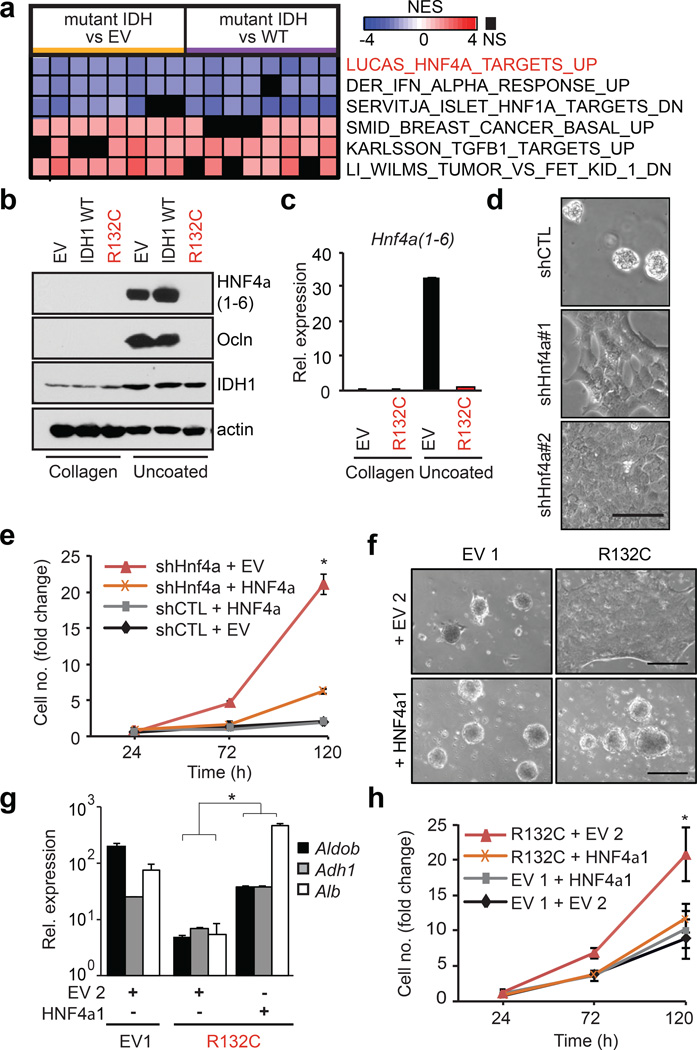
Figure 2. Mutant IDH blocks hepatocyte differentiation by silencing HNF4α.
a. Heat map of GSEA showing top-ranked gene-sets distinguishing IDH1-R132C or IDH2-R172K from WT or EV control HBs (pairwise analysis; replicates for each condition; see Methods). NES = Normalized enrichment score.
b,c. HB cells analyzed by (b) immunoblot, and (c) qRT-PCR.
d,e. Analysis of WT HBs expressing the indicated shRNAs (uncoated plates). d, Hepatocyte sphere formation. e, Proliferation of shRNA-expressing HB cells co-expressing EV or shRNA-resistant Hnf4a1 cDNA.
f–h. Control and R132C–expressing HBs co-expressing vector control (EV2) or HNF4α, grown on uncoated plates. f, hepatocyte sphere formation, g, hepatocyte gene expression, h, proliferation. *P<0.05, Scale bar, 100µm (d), 250µm (f).

