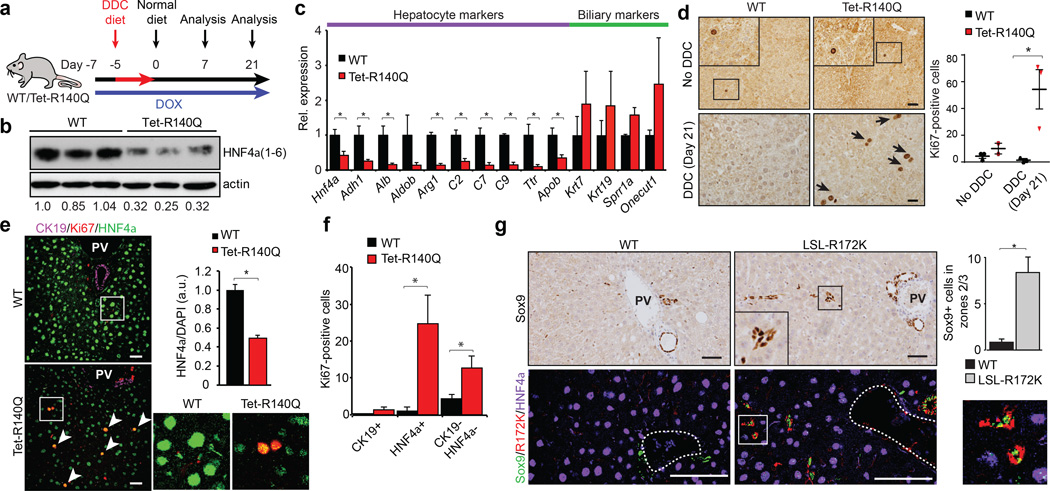
Figure 3. Mutant IDH inhibits hepatocyte differentiation and quiescence of liver progenitors.
a. Schematic of DDC study in Tet-R140Q (Tet-R140Q, Alb-Cre, Rosa26-LSL-rtTA) and WT littermate controls (Alb-Cre, Rosa26-LSL-rtTA).
b–f.Livers at day 21. b, Immunoblot (HNF4α1–6:actin is quantified). c, qRT-PCR. d, Ki-67 staining. Chart: Ki-67+ cells/20 high-powered fields. e,f, IF analysis. Graph: mean fluorescence intensity of HNF4α:DAPI (125 cells/group were scored). Inset: high power views of boxed regions. f, Quantification of Ki-67+ cells co-staining for the indicated markers (N = 3 mice/group, 5 high-powered fields/mouse).
g. IHC (top) and IF (bottom) of WT and LSL-R172K livers at 20 months. Note accumulation Sox9+ cells located >25µm away from bile duct or portal structures (dashed-line), which express IDH2-R172K and lack HNF4α. Inset: higher magnification. Chart: quantification. N = 3 mice/group; 4 high-powered images/mouse were scored. PV=Portal vein.
Error bars, ±s.d. (c) and ±s.e.m. (d, f, g); Scale bars, 20 µm (d) and 50 µm (e, g).

