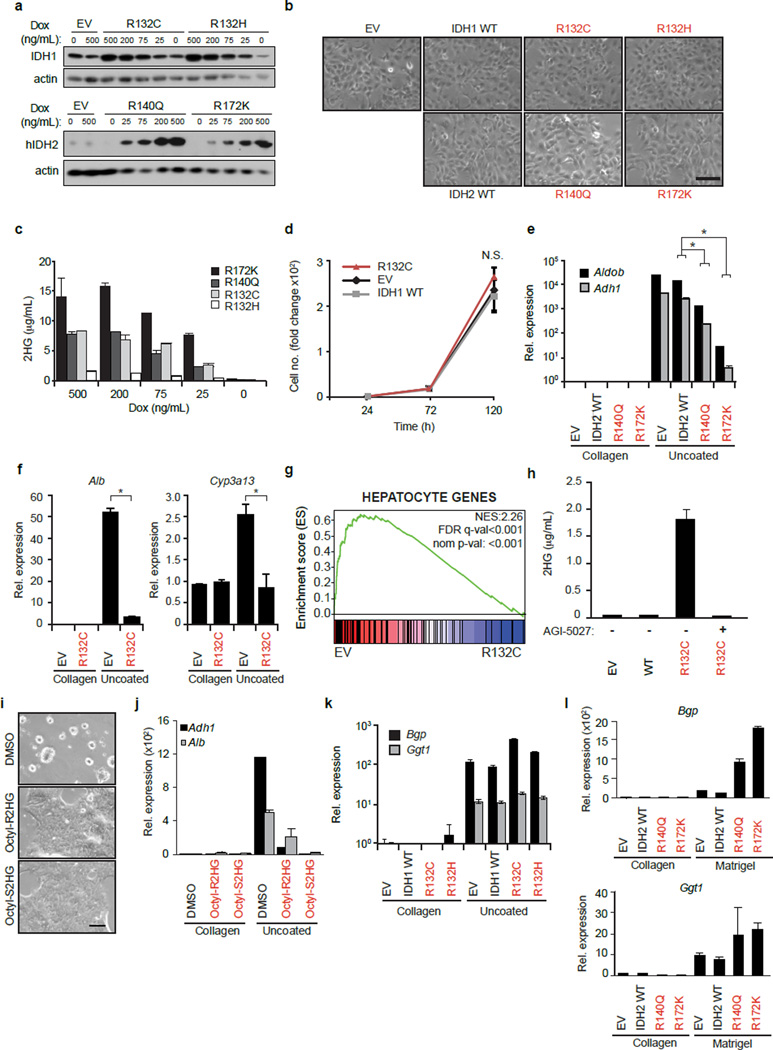
Extended Data Figure 1. Impact of mutant IDH1 and IDH2 on HB cell differentiation.
a. Primary HB cells were engineered to express the indicated human IDH alleles or empty vector (EV) under a Dox-inducible system. Lysates from HB cells cultured in the presence of increasing Dox concentrations were analyzed by immunoblot using an antibody that recognizes both murine and human IDH1 (Upper panel) or with an antibody specific to human IDH2 (lower panel); actin is the loading control. Note that 25 ng/ml Dox induces physiologic levels of IDH1 expression and was used in the experiments shown in Fig. 1 and 2 of the main text.
b. Photomicrographs of cells grown for 2 days on collagen-coated plates in the presence of 25ng/mL Dox.
c. HB cells cultured in the presence of increasing Dox concentrations were analyzed by LC-MS for levels of intracellular 2HG.
d. Growth curve of HBs cultivated on collagen-coated dishes.
e, f. HB cells from (a) were grown on collagen-coated or uncoated plates and analyzed for expression of hepatocyte markers by qRT-PCR.
g. Enrichment plot showing downregulation of a hepatocyte gene set (Gene Expression Omnibus, GSE28892) in R132C-expressing cells. NES = Normalized Enrichment Score. FDR = False discovery rate.
h. 2HG levels in HB cells expressing the indicated IDH alleles or EV and treated with AGI-5027 (+) or DMSO vehicle (-).
i, j. WT HBs were treated with 500µm octyl-(R) or (S) enantiomers of 2HG or DMSO vehicle, and tested for hepatocyte differentiation upon transfer to uncoated plates by hepatocyte sphere formation (i) or qRT-PCR (j).
k, l. HB cells expressing the indicated alleles were tested for biliary differentiation upon transfer to matrigel as assessed by qRT-PCR for the induction of biliary makers Bgp and Ggt1.
Scale bars, 100µm. Error bars indicate ±s.d. between technical duplicates. * Student’s t-test P<0.05. Data are representative of at least 2 independent experiments.

