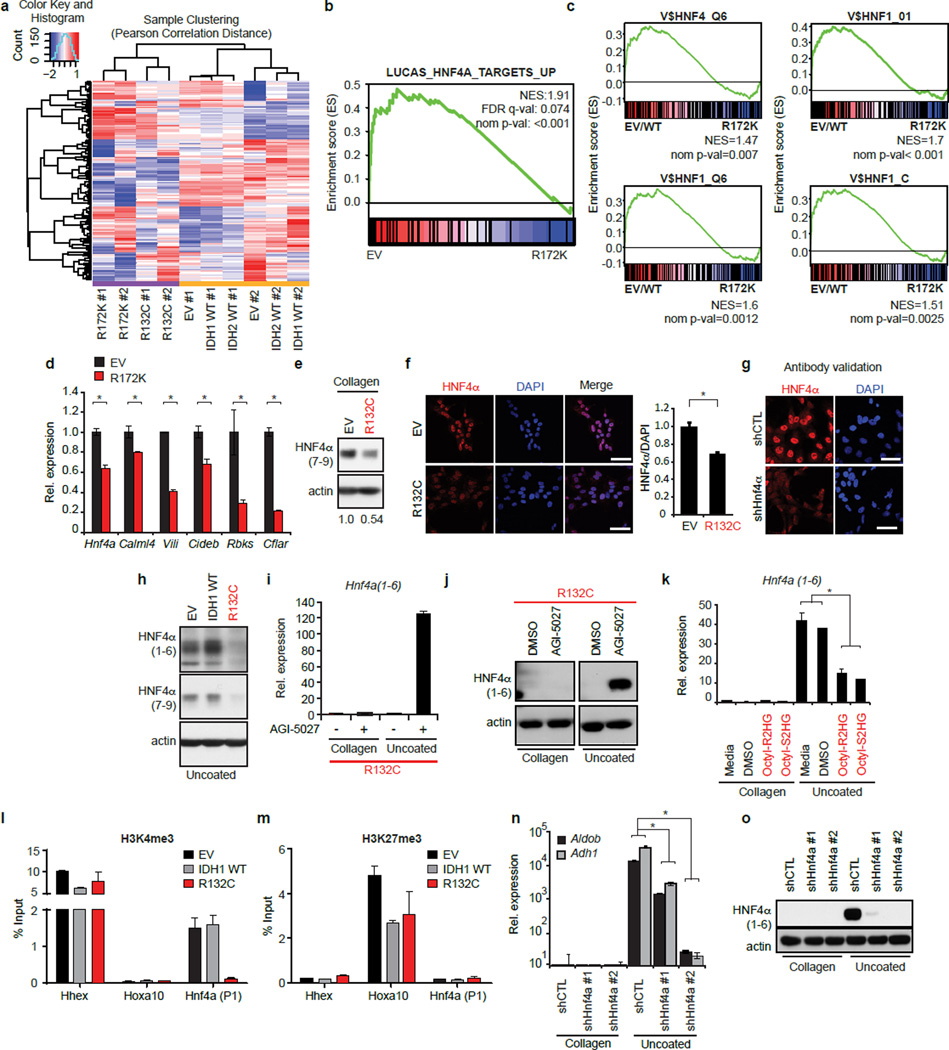
Extended Data Figure 2. Mutant IDH represses the HNF4α-mediated hepatocyte differentiation program.
a–c. Gene expression profiling of HB cells expressing the indicated alleles and grown on collagen. (a) Clustering analysis, (b) enrichment plot (GSEA) showing downregulation of HNF4α targets in the IDH mutant cells relative to controls, (c) GSEA plots using the collection of cis regulatory elements from the Molecular Signatures Database (C3 collection) reveals strong downregulation of genes containing consensus HNF4α and HNF1α binding sites in the IDH mutant HB cultures.
d. qRT-PCR showing expression of Hnf4a and its target genes in HB cells expressing either EV or IDH2 R172K and grown on collagen-coated plates.
e. HNF4α(7–9) expression (immunoblot) in HB cells grown on collagen-coated plates (quantification of HNF4α:actin is indicated). Data are representative of 2 independent experiments.
f, g. Immunofluorescence (IF) staining for HNF4α (using an antibody that detects all isoforms) in HB cells expressing EV or IDH1 R132C and grown on collagen (f). The chart shows quantification of the ratio of the HNF4α and DAPI signals. The specificity of the antibody was demonstrated by the diminished staining in cells with knockdown of endogenous HNF4α (g).
h. Immunoblot showing that R132C suppresses HNF4α(1–6) and HNF4α(7–9) isoforms on uncoated plates.
i, j. AGI-5027 restores Hnf4a(1–6) induction in R132C-expressing HBs as shown by qRT-PCR (i) and immunoblot (j). DMSO=vehicle.
k. WT HBs were treated with 500µm octyl-(R) or -(S) enantiomers of 2HG, DMSO vehicle, or media alone. Hnf4a1–6 levels were determined by qRT-PCR.
l, m. Cultures of HB cells expressing the indicated alleles were grown on collagen or transferred to uncoated plates for 5 days and subjected to chromatin immunoprecipitation (ChIP) for H3K4me3 (l) or H3K27me3 (m). Enrichment for the promoter regions of Hhex (highly expressed gene in HB cells), Hoxa10 (transcriptionally silent in HB cells) and P1 Hnf4a was measured by qPCR.
n, o. Analysis of WT HBs expressing shRNA control (shCTL) or targeting different HNF4a sequences (shHnf4a#1, shHnf4a#2): (n) hepatocyte marker expression (qRT-PCR) (o) HNF4a immunoblot.
Error bars indicate ±s.e.m for (f) and ±s.d. for (d, i, k-n) between technical duplicates. Scale bars indicate 50 µm. Student’s t-test * P<0.05.

