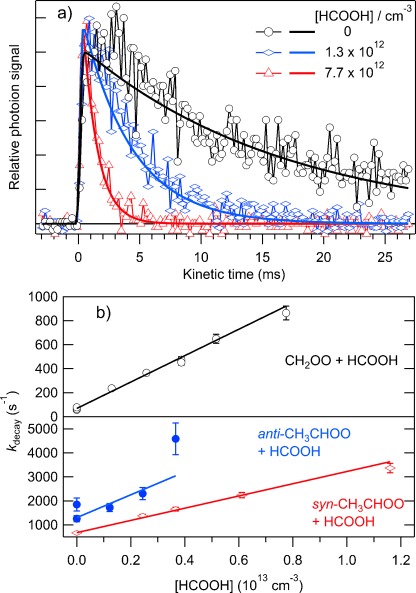
Figure 1.

Kinetics results from the MPIMS experiments. a) CH2OO time traces as a function of [HCOOH] taken using a H2 discharge lamp for ionization, and fits to the experimental data. b) Dependence of the decay constant of CH2OO (black; taken with a H2 discharge), anti-CH3CHOO (blue; taken using 9.35 eV synchrotron radiation), and syn-CH3CHOO (blue; taken using 10.5 eV synchrotron radiation). The solid lines are fits to the experimental data. The slopes are the second-order rate coefficients for the CI+acid reactions. Error bars reflect the 1σ uncertainties from the fits of the experimental time profiles.
