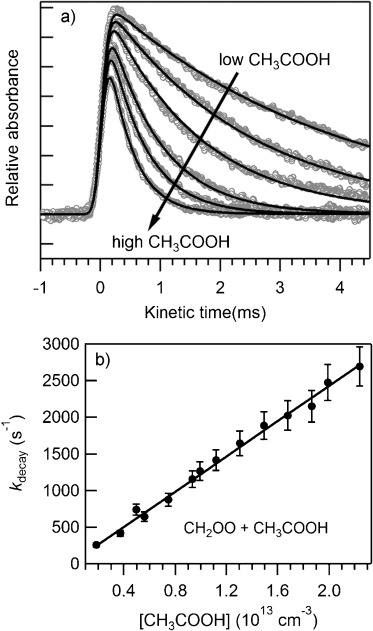
Figure 2.

Kinetics results from the UV absorption experiments. a) CH2OO time traces for [CH3COOH] in the range (1.86–22.39)×1012 cm−3, and fits to the experimental data. b) Dependence of the decay constant of CH2OO on [CH3COOH]. The solid line is a fit to the experimental data with the slope as the second-order rate coefficient for the CH2OO+CH3COOH reaction. Error bars shown are 15 % of the nominal value as estimated from repeated experiments at identical conditions.
