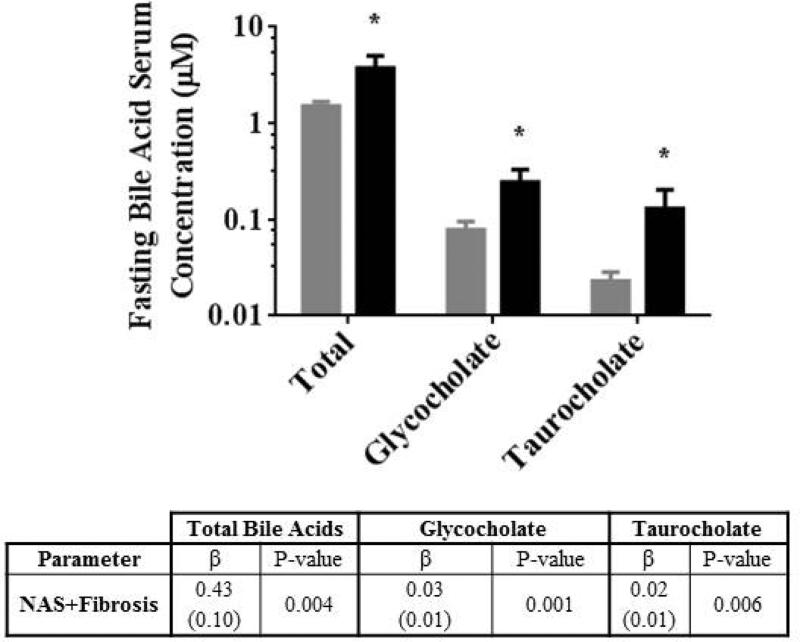
Figure 2.
Fasting total bile acids, glycocholate and taurocholate serum concentrations in healthy subjects (grey bars) and patients with NASH (black bars). Data are presented as mean ± SE; * P<0.05. Results of univariate linear regression analysis of NASH severity (NAS+Fibrosis; sum of non-alcoholic fatty liver disease activity and fibrosis scores) with bile acid serum concentrations are included. Data are presented as the regression parameter estimate (β) with SE of the parameter estimate in parentheses.

