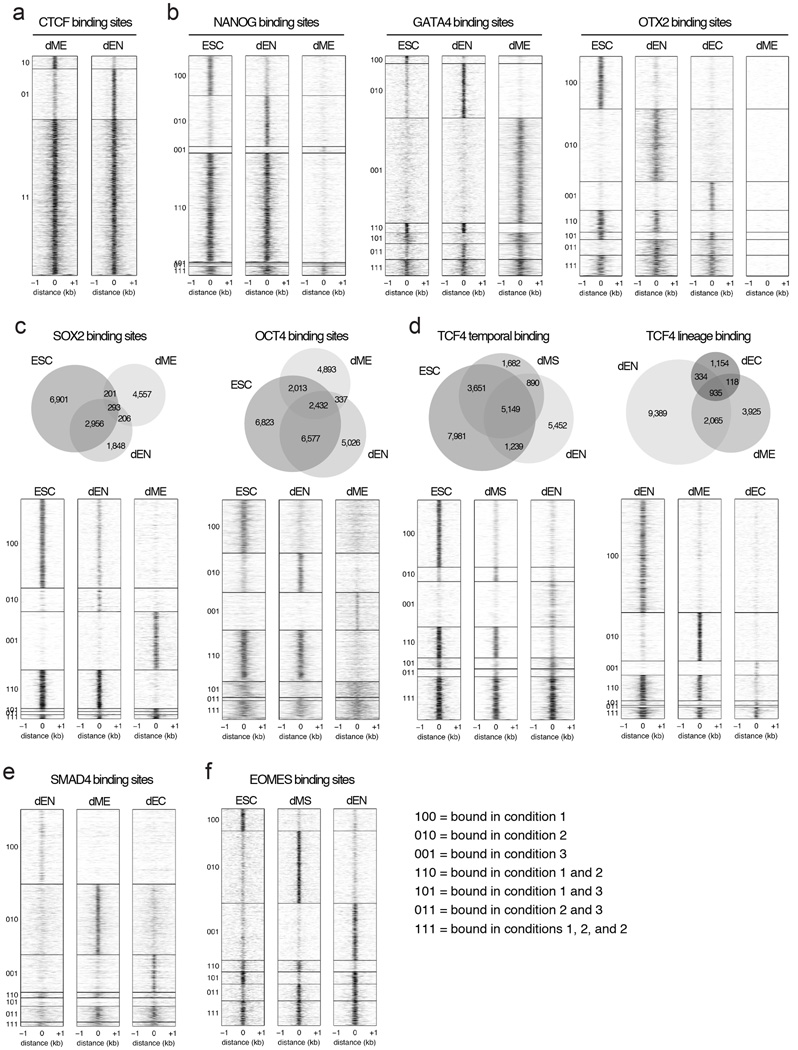
Extended Data Fig. 4. Venn diagrams and heatmaps highlighting different TF binding dynamics in human ESCs and their derivatives.
a. Heatmaps show that CTCF binding overlaps highly in dEN and dME. Heatmaps display normalized binding occupancy averaged using 50bp bins. Regions are centered on the merged binding peaks for the two cell types, where 10=regions bound in dME, 01=bound in dEN, 11=bound in both.
b. Heatmaps show that NANOG binding is static in ESCs and dEN and suppressed in dME (left). In contrast, GATA4 binding is highly dynamic between dEN and dME and enhanced in the germ layers relative to ESCs (middle). Finally, OTX2 binding is dynamic in dEN and dEC relative to ESCs, but suppressed in dME (right). Heatmaps display normalized binding occupancy averaged using 50bp bins. Regions are centered on the merged binding peaks for the three conditions, where regions 100, 010, 001, 110, 101, 111 are defined in legend on bottom right (panel 4f).
c. Venn diagrams (top) and heatmaps (bottom) show the binding dynamics of SOX2 (left) and OCT4 (right). Heatmaps display normalized binding occupancy averaged using 50bp bins. Regions are centered on the merged binding peaks for the three conditions, where regions 100, 010, 001, 110, 101, 111 are defined in legend in panel 4f.
d. Venn diagram (top) and heatmaps (bottom) show that TCF4 binding is temporally static in dMS and dEN (left) and suppressed in dME and dEC relative to dEN (right).
e. Heatmaps show that SMAD4 predominantly binds to unique regions in the three germ layers.
f. Heatmaps show that EOMES binding is enhanced from ESCs to dMS and dynamic in dEN. Heatmaps display normalized binding occupancy averaged using 50bp bins. Regions are centered on the merged binding peaks for the three conditions, where regions 100, 010, 001, 110, 101, 111 are defined in legend on the right.

