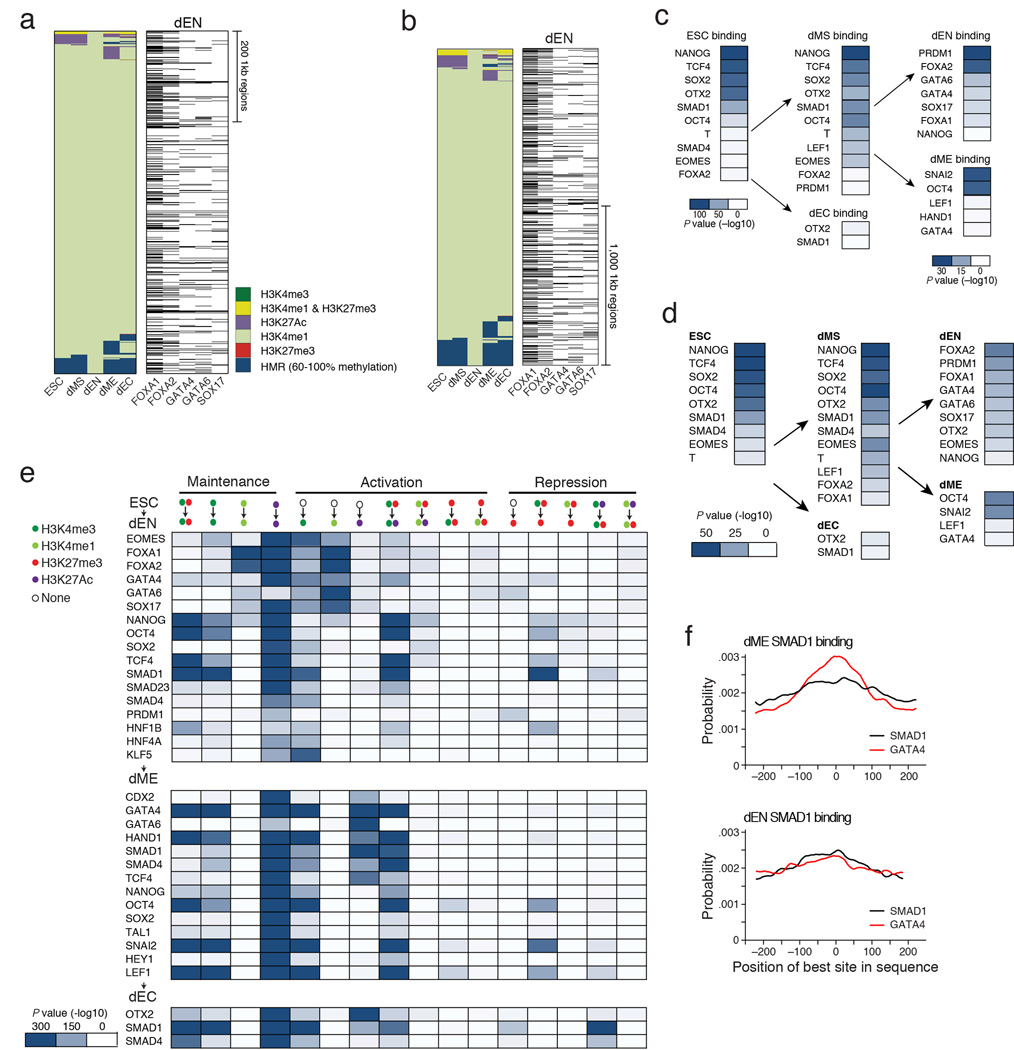
Extended Data Fig. 8. related to Fig. 5: Regulation of poised enhancers and other epigenetic state transitions.
a. Left: Alternative lineage chromatin states of dEN H3K4me1 super-enhancers (n=309, merging 760 1kb regions shown as columns in the heatmap). Chromatin states that are displayed in the panel are explained in the legend (bottom right, HMR=Highly Methylated Region). Right: Corresponding binding of the most enriched TFs in dEN, where the black bars indicate TF binding.
b. Left: Alternative lineage chromatin states of the top 2,000 1kb-long dEN H3K4me1 enhancers in dEN (shown as columns in the heatmap). Chromatin states that are displayed in the panel are defined in the legend (bottom right, HMR=Highly Methylated Region). Right: Corresponding binding of the most enriched TFs in dEN, where the black bars indicate TF binding. Increasing the number of regions displayed shows a higher enrichment for dEN factors at H3K4me1 enhancers than when only surveying the top 760 1kb regions (Extended Data Fig. 8a).
c. Enrichment P values (−log10) for the most significant overlaps between all poised putative enhancers (H3K27me3 & H3K4me1) and each TF’s binding profile in the respective cell type. Enrichment P values for dEN and dME (right column) are lower than in ESCs, which is likely the result of the overall smaller number of poised enhancers in those two germ layers. The scale is therefore adjusted for dEN and dME as shown in the respective legends. In ESCs, we find that poised enhancers are highly enriched for binding by OSN, OTX2, TCF4 and SMAD1 in the pluripotent state (Extended Data Fig. 8c–d). In dMS, we see the same regulators along with T, EOMES, and LEF1 are present at poised enhancers (Extended Data Fig. 8c–d, center). In contrast, poised enhancers in dEN show strong enrichment for PRDM1 and many of the regulators mentioned above (Extended Data Fig. 8c–d, right). Lastly, in dME, we find enrichment for SNAI2, which is known for its activity in mesoderm including blood development49.
d. Summary table of enrichment P values (−log10) displaying the most significant overlaps between the top 500 poised enhancers (H2K27me3 & H3K4me1) and each TF’s binding profile within a given cell type (ESCs, left; dMS, center; dEC, bottom center; dEN and dME, right). Enrichment values are more comparable between ESCs and the germ layers, since we compare TF binding with the same number of poised enhancers (500) in each cell type. The results are consistent with Extended Data Fig. 8c, showing that the same factors are most enriched as when comparing to all poised enhancers.
e. Table of enrichment P values (−log10) in overlap between TF binding and regions with different chromatin state transitions (relative to ESCs) within each germ layer (dEN, top; dME, middle; dEC, bottom; see Supplementary Information). Possible epigenetic state transitions are shown on top and states are defined in legend on the top left. Globally, we find a much stronger enrichment for gain of H3K4me1 in dEN than in dME, particularly for the endoderm factors present at the most methylated H3K4me1 domains. Conversely, in dME we find a strong association between remodeling of H3K27Ac and the dME factors that reside at H3K27Ac genomic regions. In concordance with this global trend, GATA4 is associated with dynamics of H3K4me1 in dEN and H3K27Ac in dME.
f. Probability (y-axis) of the best match to a given motif (SMAD1 and GATA4) occurring at a given position at regions centered on SMAD1 binding in dME (top) and dEN (bottom). This probability is based only on regions that contain at least one match with score greater than the minimum score defined for this motif by Centrimo39. The position of the best GATA4 DNA binding sites (red) are more centrally enriched (P < 10−241, Centrimo39) at SMAD1 ChIP-seq peaks in dME (top) than in dEN (bottom).

