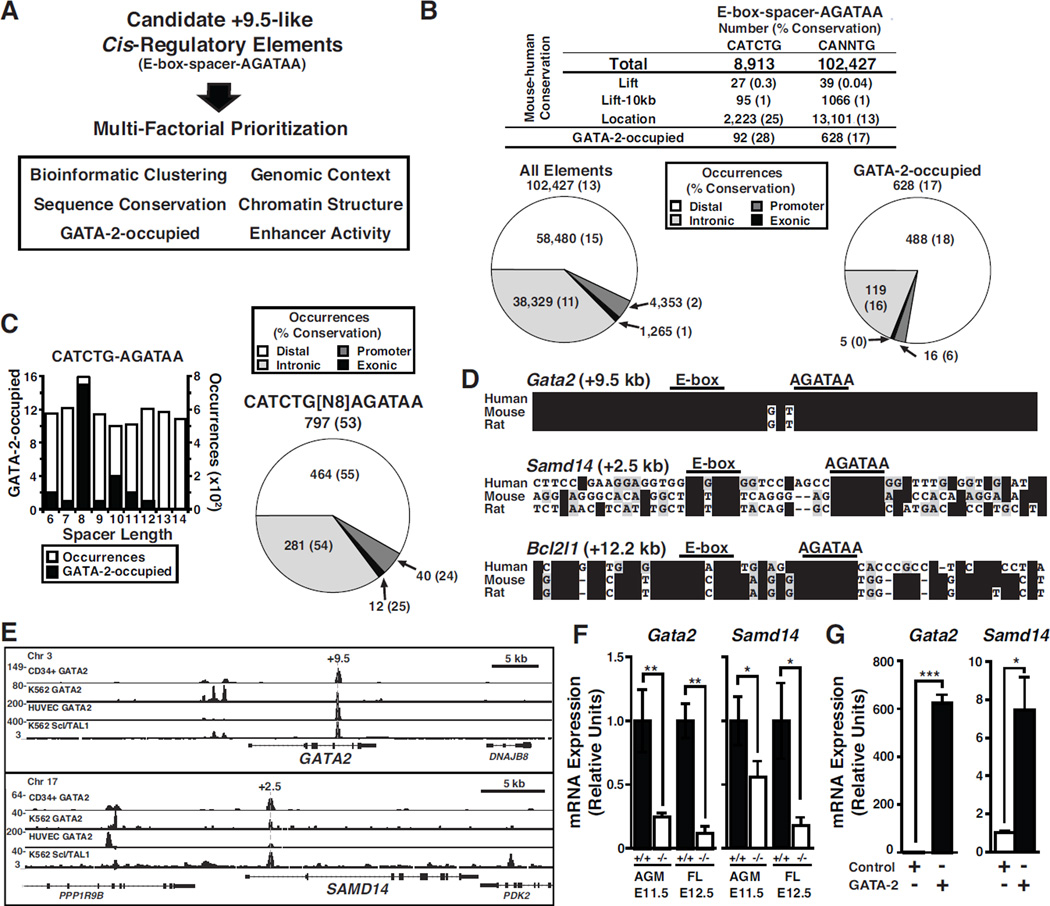
Figure 1. GATA-2-regulated Hematopoietic Stem/Progenitor Cell Cistrome.
(A) Gata2 +9.5 sequence and molecular attributes used to prioritize a “+9.5-like” element cohort. (B) Human to mouse conservation analysis of composite elements with CANNTG or CATCTG motifs by genome lift-over position or annotated location. Pie charts depict the location of human composite elements at distal, intronic, promoter and exonic. Pie chart values represent the number of elements in each location, and percent conserved in mouse (parentheses). left, all elements; right, GATA-2-occupied elements. (C) GATA-2-occupancy in murine Lin− progenitor cells at sites containing CATCTG-(N)x-AGATAA and variable spacer lengths. The pie chart depicts the location of 797 mouse elements with CATCTG-(N8)-AGATAA, and the percent conserved in human (parentheses). (D) Gata2 +9.5, Samd14 +2.5 and Bcl2l1 +12.2 conservation. (E) ChIP-seq of human CD34+ bone marrow, K562, and HUVEC cells at GATA2 and SAMD14 (GEO accessions: GSE18829, GSE29531). (F) Gata2 and Samd14 mRNA expression in E11.5 AGM and E12.5 fetal liver from the +9.5 mutant mouse (Johnson et al., 2012). (G) Gata2 and Samd14 mRNA expression in fetal liver cells infected with control (empty vector) or GATA-2-expressing retrovirus. Statistical significance: mean +/− SEM; *, p<0.05; **, p<0.01; ***, p<0.001.

