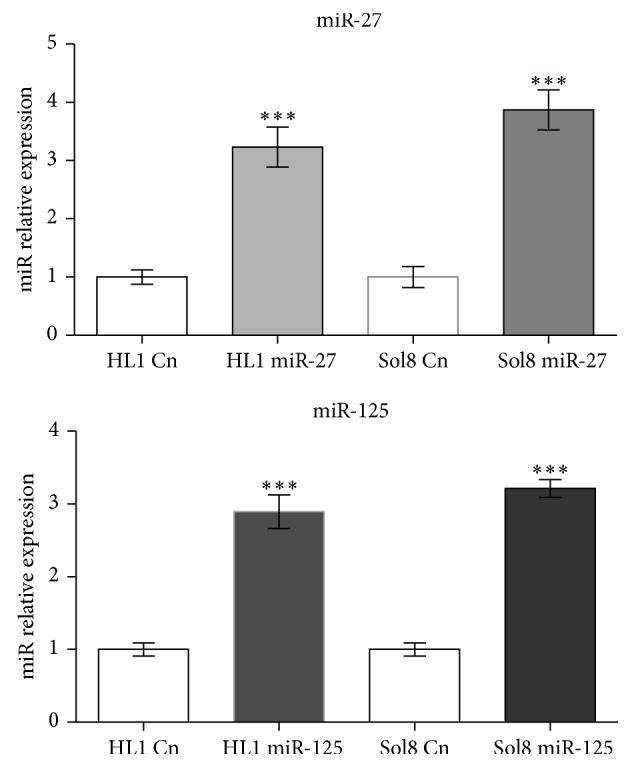
Figure 1.

qPCR analyses of miR-27 and miR-125 expression levels in HL1 and Sol8 cells transfected with pre-miR-27 and pre-miR-125, respectively, as compared to nontransfected (lipofectamine only) control cells. Observe that a similar overexpression level is achieved for both miR-27 and miR-125 in HL1 and Sol8 cells, respectively (n = 3). *** P < 0.001, **** P < 0.0001.
